climate change on UAE - Stockholm Environment Institute-US Center
climate change on UAE - Stockholm Environment Institute-US Center
climate change on UAE - Stockholm Environment Institute-US Center

Create successful ePaper yourself
Turn your PDF publications into a flip-book with our unique Google optimized e-Paper software.
mm/m<strong>on</strong>th<br />
mm/m<strong>on</strong>th (prcp)<br />
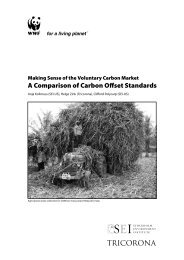
Figure 4‐4. Al Ain “average” m<strong>on</strong>thly PET and rainfall over the period 1994-2005.<br />
this cover it was assumed that the Kc value<br />
is relatively low, implying a general strategy<br />
of under-watering. The Forests land use type<br />
makes use of the same crop demand model<br />
used for the Agriculture and Forestry objects in<br />
the WEAP model.<br />
Potential evapotranspirati<strong>on</strong> (PET) is estimated<br />
using the well known Penman M<strong>on</strong>tieth<br />
method (FAO-56) and are given in units of mm/<br />
m<strong>on</strong>th. The PET was computed from m<strong>on</strong>thly<br />
observati<strong>on</strong>s of average air temperature (OC),<br />
relative humidity (RH), wind speed (m/s),<br />
and solar radiati<strong>on</strong>. In additi<strong>on</strong>, time series of<br />
m<strong>on</strong>thly total precipitati<strong>on</strong> were used to modify<br />
crop water requirements, although in this hyperarid<br />
regi<strong>on</strong>, annual evaporati<strong>on</strong> demand far<br />
exceeds annual precipitati<strong>on</strong>, and so the benefits<br />
from rainfall in terms of satisfying crop water<br />
demands are very marginal. Figure 4‐4 shows a<br />
plot of the average m<strong>on</strong>thly PET estimate for<br />
the coast (Abu Dhabi) and Interior (Al Ain).<br />
The coastal PET value is substantially lower<br />
than the interior, as the high RH suppresses<br />
PET, while lower RH and substantially higher<br />
air temperatures raises PET in the interior of<br />
Abu Dhabi Emirate. Figure 4‐4 also includes<br />
a plot of “average” m<strong>on</strong>thly rainfall over the<br />
period 1994 through 2005 for Al Ain, and should<br />
be referenced with the right y-axis of the figure.<br />
Annual rainfall is <strong>on</strong>ly about 1% of annual PET<br />
<strong>on</strong> average.<br />
4.5. Calibrati<strong>on</strong> using observed<br />
data<br />
Having described the general approach to<br />
estimating M&I, agricultural, amenity and<br />
forestry water demands, we now summarize<br />
WEAP’s ability to replicate the broad annual<br />
water supply and demand for two select years,<br />
2003 and 2005. We have chosen these two years<br />
since they corresp<strong>on</strong>d to water reporting<br />
years available from the Department of Water<br />
Resources at ERWDA. Table 4-4 summarizes<br />
the reported water use by sector for 2003 and<br />
2005 (gray columns); and the corresp<strong>on</strong>ding<br />
modeled water use (columns labeled<br />
“Model”).<br />
Our estimates of Municipal and Industrial<br />
water use are less than the reported water<br />
use, but are c<strong>on</strong>sistent with the per-capita<br />
and populati<strong>on</strong> estimates given for 2003 and<br />
2005. The discrepancy is likely due to other<br />
uses of desalinized water that are part of the<br />
reported estimate, including irrigati<strong>on</strong>. Our<br />
2003 estimates of agricultural, water, and<br />
amenity uses closely match observati<strong>on</strong>s, while<br />
our 2005 estimate of these same sectoral uses<br />
is about 15% higher than those reported. This<br />
discrepancy is a result of higher evaporative<br />
demands in 2005 relative to 2003, which<br />
increased modeled irrigati<strong>on</strong> requirements in<br />
all sectors. In additi<strong>on</strong>, there is a reported 40%<br />
reducti<strong>on</strong> in the western forestry sector “due<br />
108<br />
Climate Change Impacts, Vulnerability & Adaptati<strong>on</strong>