climate change on UAE - Stockholm Environment Institute-US Center
climate change on UAE - Stockholm Environment Institute-US Center
climate change on UAE - Stockholm Environment Institute-US Center

Create successful ePaper yourself
Turn your PDF publications into a flip-book with our unique Google optimized e-Paper software.
water height of each tidal day observed over the<br />
Nati<strong>on</strong>al Tidal Datum Epoch. Unfortunately,<br />
Mmsl data is publicly available for <strong>on</strong>ly three<br />
years for the <strong>UAE</strong>, (PSMSL, 2008) and MHHW<br />
was not available from sources c<strong>on</strong>sulted. Since<br />
available tide data is c<strong>on</strong>sidered insufficient for<br />
a tidal analysis, this report relies <strong>on</strong> existing<br />
analysis of tidal dynamics found in the literature,<br />
as referenced below, to best understand how<br />
tidal variati<strong>on</strong> may shift with <str<strong>on</strong>g>climate</str<strong>on</strong>g> <str<strong>on</strong>g>change</str<strong>on</strong>g><br />
induced sea level rise.<br />
Mean sea level is not just influenced by<br />
tidal dynamics but by Arabian Gulf thermal<br />
expansi<strong>on</strong> as well. For a detailed explanati<strong>on</strong><br />
of those dynamics it is suggested to revisit<br />
secti<strong>on</strong>s “2.3 Sea-surface temperatures, thermal<br />
expansi<strong>on</strong>, and thermosteric sea level rise” and<br />
“2.4 Increase in the tidal variati<strong>on</strong> around the<br />
mean”. Separate from these processes, which<br />
have altered sea levels for millennia, based<br />
<strong>on</strong> the available literature, net sea level rise is<br />
defined as the historical sea level rise rate plus<br />
the accelerated rate due to global warming<br />
minus the estimated accreti<strong>on</strong> rate for each<br />
type of tidal wetland calculated annually over<br />
the 200 year time period (J<strong>on</strong>es and Strange,<br />
2008).<br />
For lack of better elevati<strong>on</strong> data, the analysis<br />
<strong>on</strong> SRTM data is from the CGIAR-CSI<br />
(C<strong>on</strong>sortium for Spatial Informati<strong>on</strong>) GeoPortal<br />
which provides processed SRTM 90m DEM for<br />
the entire world. Produced by NASA originally,<br />
the data made available by CGIAR-CSI was<br />
processed to fill data voids and to facilitate its<br />
ease of use by a wide group of potential users.<br />
This was found to be the most comprehensive<br />
and c<strong>on</strong>sistent elevati<strong>on</strong> data for the United<br />
Arab Emirates available publicly at the time<br />
of the analysis. Also, it is worth noting that the<br />
SRTM data is also <strong>on</strong>ly available in integers<br />
the implicati<strong>on</strong>s of which, with respect to the<br />
floodfill model, limits the scenarios we can run<br />
to the values in the existing data set.<br />
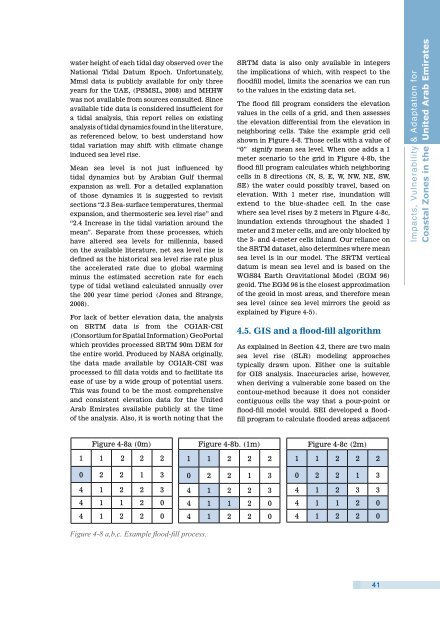
The flood fill program c<strong>on</strong>siders the elevati<strong>on</strong><br />
values in the cells of a grid, and then assesses<br />
the elevati<strong>on</strong> differential from the elevati<strong>on</strong> in<br />
neighboring cells. Take the example grid cell<br />
shown in Figure 4‐8. Those cells with a value of<br />
“0” signify mean sea level. When <strong>on</strong>e adds a 1<br />
meter scenario to the grid in Figure 4-8b, the<br />
flood fill program calculates which neighboring<br />
cells in 8 directi<strong>on</strong>s (N, S, E, W, NW, NE, SW,<br />
SE) the water could possibly travel, based <strong>on</strong><br />
elevati<strong>on</strong>. With 1 meter rise, inundati<strong>on</strong> will<br />
extend to the blue-shadec cell. In the case<br />
where sea level rises by 2 meters in Figure 4-8c,<br />
inundati<strong>on</strong> extends throughout the shaded 1<br />
meter and 2 meter cells, and are <strong>on</strong>ly blocked by<br />
the 3- and 4-meter cells inland. Our reliance <strong>on</strong><br />
the SRTM dataset, also determines where mean<br />
sea level is in our model. The SRTM vertical<br />
datum is mean sea level and is based <strong>on</strong> the<br />
WGS84 Earth Gravitati<strong>on</strong>al Model (EGM 96)<br />
geoid. The EGM 96 is the closest approximati<strong>on</strong><br />
of the geoid in most areas, and therefore mean<br />
sea level (since sea level mirrors the geoid as<br />
explained by Figure 4‐5).<br />
4.5. GIS and a flood-fill algorithm<br />
As explained in Secti<strong>on</strong> 4.2, there are two main<br />
sea level rise (SLR) modeling approaches<br />
typically drawn up<strong>on</strong>. Either <strong>on</strong>e is suitable<br />
for GIS analysis. Inaccuracies arise, however,<br />
when deriving a vulnerable z<strong>on</strong>e based <strong>on</strong> the<br />
c<strong>on</strong>tour-method because it does not c<strong>on</strong>sider<br />
c<strong>on</strong>tiguous cells the way that a pour-point or<br />
flood-fill model would. SEI developed a floodfill<br />
program to calculate flooded areas adjacent<br />
Impacts, Vulnerability & Adaptati<strong>on</strong> for<br />
Coastal Z<strong>on</strong>es in the United Arab Emirates<br />
Figure 4-8a (0m)<br />
1 1 2 2 2<br />
0 2 2 1 3<br />
4 1 2 2 3<br />
4 1 1 2 0<br />
4 1 2 2 0<br />
Figure 4-8b. (1m)<br />
1 1 2 2 2<br />
0 2 2 1 3<br />
4 1 2 2 3<br />
4 1 1 2 0<br />
4 1 2 2 0<br />
Figure 4-8c (2m)<br />
1 1 2 2 2<br />
0 2 2 1 3<br />
4 1 2 3 3<br />
4 1 1 2 0<br />
4 1 2 2 0<br />
Figure 4‐8 a,b,c. Example flood-fill process.<br />
41