climate change on UAE - Stockholm Environment Institute-US Center
climate change on UAE - Stockholm Environment Institute-US Center
climate change on UAE - Stockholm Environment Institute-US Center
You also want an ePaper? Increase the reach of your titles
YUMPU automatically turns print PDFs into web optimized ePapers that Google loves.
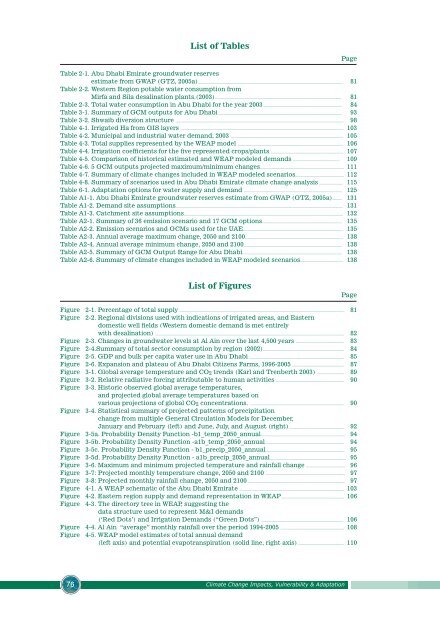
List of Tables<br />
Page<br />
Table 2‐1. Abu Dhabi Emirate groundwater reserves<br />
estimate from GWAP (GTZ, 2005a)................................................................................................................................................... 81<br />
Table 2‐2. Western Regi<strong>on</strong> potable water c<strong>on</strong>sumpti<strong>on</strong> from<br />
Mirfa and Sila desalinati<strong>on</strong> plants.(2003)................................................................................................................................ 81<br />
Table 2-3. Total water c<strong>on</strong>sumpti<strong>on</strong> in Abu Dhabi for the year 2003 ............................................................................... 84<br />
Table 3‐1. Summary of GCM outputs for Abu Dhabi ............................................................................................................................. 93<br />
Table 3‐2. Shwaib diversi<strong>on</strong> structure .......................................................................................................................................................................... 98<br />
Table 4‐1. Irrigated Ha from GIS layers ..................................................................................................................................................................... 103<br />
Table 4‐2. Municipal and industrial water demand, 2003 .................................................................................................................. 105<br />
Table 4‐3. Total supplies represented by the WEAP model ........................................................................................................... 106<br />
Table 4‐4. Irrigati<strong>on</strong> coefficients for the five represented crops/plants. ......................................................................... 107<br />
Table 4‐5. Comparis<strong>on</strong> of historical estimated and WEAP modeled demands ............................................... 109<br />
Table 4‐6. 5 GCM outputs projected maximum/minimum <str<strong>on</strong>g>change</str<strong>on</strong>g>s..................................................................................... 111<br />
Table 4‐7. Summary of <str<strong>on</strong>g>climate</str<strong>on</strong>g> <str<strong>on</strong>g>change</str<strong>on</strong>g>s included in WEAP modeled scenarios................................................. 112<br />
Table 4‐8. Summary of scenarios used in Abu Dhabi Emirate <str<strong>on</strong>g>climate</str<strong>on</strong>g> <str<strong>on</strong>g>change</str<strong>on</strong>g> analysis ........................ 115<br />
Table 6‐1. Adaptati<strong>on</strong> opti<strong>on</strong>s for water supply and demand ................................................................................................... 125<br />
Table A1-1. Abu Dhabi Emirate groundwater reserves estimate from GWAP (GTZ, 2005a).......... 131<br />
Table A1-2. Demand site assumpti<strong>on</strong>s......................................................................................................................................................................... 131<br />
Table A1-3. Catchment site assumpti<strong>on</strong>s................................................................................................................................................................. 132<br />
Table A2-1. Summary of 36 emissi<strong>on</strong> scenario and 17 GCM opti<strong>on</strong>s................................................................................. 135<br />
Table A2-2. Emissi<strong>on</strong> scenarios and GCMs used for the <strong>UAE</strong>..................................................................................................... 135<br />
Table A2-3. Annual average maximum <str<strong>on</strong>g>change</str<strong>on</strong>g>, 2050 and 2100................................................................................................... 138<br />
Table A2-4. Annual average minimum <str<strong>on</strong>g>change</str<strong>on</strong>g>, 2050 and 2100.................................................................................................... 138<br />
Table A2-5. Summary of GCM Output Range for Abu Dhabi..................................................................................................... 138<br />
Table A2-6. Summary of <str<strong>on</strong>g>climate</str<strong>on</strong>g> <str<strong>on</strong>g>change</str<strong>on</strong>g>s included in WEAP modeled scenarios........................................... 138<br />
List of Figures<br />
Page<br />
Figure 2‐1. Percentage of total supply ....................................................................................................................................................................... 81<br />
Figure 2‐2. Regi<strong>on</strong>al divisi<strong>on</strong>s used with indicati<strong>on</strong>s of irrigated areas, and Eastern<br />
domestic well fields (Western domestic demand is met entirely<br />
with desalinati<strong>on</strong>) ............................................................................................................................................................................................... 82<br />
Figure 2‐3. Changes in groundwater levels at Al Ain over the last 4,500 years ................................................. 83<br />
Figure 2-4.Summary of total sector c<strong>on</strong>sumpti<strong>on</strong> by regi<strong>on</strong> (2002).................................................................................. 84<br />
Figure 2‐5. GDP and bulk per capita water use in Abu Dhabi ................................................................................................ 85<br />
Figure 2‐6. Expansi<strong>on</strong> and plateau of Abu Dhabi Citizens Farms, 1996-2005 .................................................... 87<br />
Figure 3‐1. Global average temperature and CO 2 trends (Karl and Trenberth 2003) ........................... 89<br />
Figure 3‐2. Relative radiative forcing attributable to human activities ..................................................................... 90<br />
Figure 3‐3. Historic observed global average temperatures,<br />
and projected global average temperatures based <strong>on</strong><br />
various projecti<strong>on</strong>s of global CO 2 c<strong>on</strong>centrati<strong>on</strong>s. ............................................................................................... 90<br />
Figure 3‐4. Statistical summary of projected patterns of precipitati<strong>on</strong><br />
<str<strong>on</strong>g>change</str<strong>on</strong>g> from multiple General Circulati<strong>on</strong> Models for December,<br />
January and February (left) and June, July, and August (right)........................................................ 92<br />
Figure 3‐5a. Probability Density Functi<strong>on</strong> -b1_temp_2050_annual..................................................................................... 94<br />
Figure 3‐5b. Probability Density Functi<strong>on</strong> -a1b_temp_2050_annual................................................................................ 94<br />
Figure 3‐5c. Probability Density Functi<strong>on</strong> - b1_precip_2050_annual................................................................................ 95<br />
Figure 3‐5d. Probability Density Functi<strong>on</strong> - a1b_precip_2050_annual............................................................................. 95<br />
Figure 3‐6. Maximum and minimum projected temperature and rainfall <str<strong>on</strong>g>change</str<strong>on</strong>g> ....................................... 96<br />
Figure 3‐7: Projected m<strong>on</strong>thly temperature <str<strong>on</strong>g>change</str<strong>on</strong>g>, 2050 and 2100 ................................................................................ 97<br />
Figure 3‐8: Projected m<strong>on</strong>thly rainfall <str<strong>on</strong>g>change</str<strong>on</strong>g>, 2050 and 2100 .................................................................................................. 97<br />
Figure 4‐1. A WEAP schematic of the Abu Dhabi Emirate .......................................................................................................... 103<br />
Figure 4‐2. Eastern regi<strong>on</strong> supply and demand representati<strong>on</strong> in WEAP................................................................ 106<br />
Figure 4‐3. The directory tree in WEAP, suggesting the<br />
data structure used to represent M&I demands<br />
(‘Red Dots’) and Irrigati<strong>on</strong> Demands (“Green Dots”) ................................................................................... 106<br />
Figure 4‐4. Al Ain “average” m<strong>on</strong>thly rainfall over the period 1994-2005 ................................................................ 108<br />
Figure 4‐5. WEAP model estimates of total annual demand<br />
(left axis) and potential evapotranspirati<strong>on</strong> (solid line, right axis). ............................................. 110<br />
76<br />
Climate Change Impacts, Vulnerability & Adaptati<strong>on</strong>


