climate change on UAE - Stockholm Environment Institute-US Center
climate change on UAE - Stockholm Environment Institute-US Center
climate change on UAE - Stockholm Environment Institute-US Center

You also want an ePaper? Increase the reach of your titles
YUMPU automatically turns print PDFs into web optimized ePapers that Google loves.
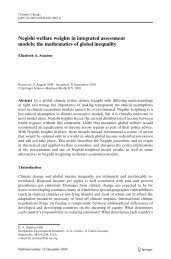
y 2100. Figure 2‐6 captures this observati<strong>on</strong> of<br />
sea level <str<strong>on</strong>g>change</str<strong>on</strong>g>, where each study reviewed is<br />
represented by a different line in the graph. The<br />
shaded area and the vertical red and green error<br />
bars represent the 90% c<strong>on</strong>fidence interval. The<br />
black and red curves denote the deviati<strong>on</strong> from<br />
their 1961-1990 average, the shorter green curve<br />
the deviati<strong>on</strong> from the average of the black<br />
curve for the period 1993 to 2003 (IPCC, 2007).<br />
Warmer SST will lead to thermal expansi<strong>on</strong> in<br />
the Gulf and <str<strong>on</strong>g>change</str<strong>on</strong>g>s in mean sea level. Sea level<br />
data collected from 11 stati<strong>on</strong>s in the Arabian<br />
Gulf already indicate rising levels. Increased<br />
SST could lead to higher peaks of storm surges,<br />
increased cycl<strong>on</strong>e intensity, and a greater risk<br />
of coastal disasters; warmer waters also undermine<br />
temperature-sensitive coastal ecosystem<br />
functi<strong>on</strong>ing.<br />
Thermosteric sea level is high in the summer<br />
(June, July, and August) and autumn<br />
(September, October, and November) and<br />
low during spring (May, April, and March) and<br />
winter (December, January, and February).<br />
The distributi<strong>on</strong> of the thermosteric sea<br />
level shows larger variati<strong>on</strong>s in sea level in<br />
spring than in winter. “Worst case scenario”<br />
adaptati<strong>on</strong> measures will need to target spring<br />
mean sea levels due to both larger thermosteric<br />
variati<strong>on</strong>s layered <strong>on</strong> top of large spring tidal<br />
means (as will be explored in Secti<strong>on</strong> 2.4).<br />
2.4. Increase in the tidal variati<strong>on</strong><br />
around the mean<br />
Tidal dynamics in the Arabian Gulf are<br />
admittedly unusual. At most tidal stati<strong>on</strong>s, the<br />
tidal range maximum occurs in July (summer)<br />
and the minimum in February for most stati<strong>on</strong>s.<br />
In northern and southern mid-latitudes, the<br />
lowest sea level in the annual cycle occurs<br />
during spring and is highest in the autumn<br />
(Hassanzadeh, 1997; Tabata et al., 1998), but over<br />
the Arabian Gulf, this feature is different. The<br />
vertical extent of the intertidal z<strong>on</strong>e depends<br />
mainly <strong>on</strong> the tidal range, wave acti<strong>on</strong> and<br />
slope of the shore. On sheltered steeply sloping<br />
shores, the height of the intertidal corresp<strong>on</strong>ds<br />
closely to the tidal range, narrow throughout<br />
much of the <strong>UAE</strong>. Al<strong>on</strong>g unprotected coasts,<br />
str<strong>on</strong>g wave acti<strong>on</strong> causes the intertidal z<strong>on</strong>e to<br />
extend upwards above normal high-tide levels.<br />
The tide waves entering the Straits of Hormuz<br />
generate two large rotary waves for the<br />
semidiurnal tide (two highs and two lows each<br />
day), and a single large rotary wave for the<br />
diurnal tide inside the Gulf. This leads to two<br />
distinct tide patterns in the Iranian coast of<br />
Arabian Gulf. One is found at eastern boundary<br />
(the Strait of Hormuz) and the other at the<br />
northern Gulf or western. Seas of up to 5.4m<br />
swells in the Eastern Gulf tend to predominate<br />
from NW and SE, and swells of 1.8m and higher<br />
occur in the Central Gulf.<br />
Baseline sea level elevati<strong>on</strong> and subsequent tidal<br />
variati<strong>on</strong> around a mean is best determined by<br />
the m<strong>on</strong>thly mean sea level (mmsl). In Figure<br />
2‐7, we can see how mmsl <str<strong>on</strong>g>change</str<strong>on</strong>g>s: the blue<br />
line shown in the figure at left represents the<br />
predicted (astr<strong>on</strong>omical) tide. By subtracting the<br />
predicted hourly tide from the observed hourly<br />
water levels (red line), the researchers obtained<br />
the residual <str<strong>on</strong>g>change</str<strong>on</strong>g> in water level (green line).<br />
Improved estimates of sea level trends rely <strong>on</strong><br />
improving tidal gauge data collecti<strong>on</strong> the in the<br />
Arabian Gulf. Mmsl data is publicly available<br />
for <strong>on</strong>ly three years for the <strong>UAE</strong> (PSMSL, 2008).<br />
As such data is insufficient for a tidal analysis;<br />
this report relies <strong>on</strong> existing analysis of tidal<br />
dynamics found in the literature, as synthesized<br />
below, to best understand how tidal variati<strong>on</strong><br />
may shift with <str<strong>on</strong>g>climate</str<strong>on</strong>g> <str<strong>on</strong>g>change</str<strong>on</strong>g> induced sea level<br />
rise.<br />
Figure 2‐7. Residual <str<strong>on</strong>g>change</str<strong>on</strong>g> in water level based<br />
<strong>on</strong> observed and predicted water levels.<br />
In Safaniya, a coastal town less than two<br />
hundred kilometers to the northwest of Ras<br />
Tanura, the tide is mixed, though mainly diurnal.<br />
Whereas in Ras Tanura, a major oil terminal <strong>on</strong><br />
the west side of the Arabian Gulf, has a large<br />
22<br />
Climate Change Impacts, Vulnerability & Adaptati<strong>on</strong>