climate change on UAE - Stockholm Environment Institute-US Center
climate change on UAE - Stockholm Environment Institute-US Center
climate change on UAE - Stockholm Environment Institute-US Center

Create successful ePaper yourself
Turn your PDF publications into a flip-book with our unique Google optimized e-Paper software.
5. Results and<br />
Discussi<strong>on</strong><br />
The <str<strong>on</strong>g>climate</str<strong>on</strong>g> <str<strong>on</strong>g>change</str<strong>on</strong>g> assumpti<strong>on</strong>s for the three<br />
main Scenarios are reflected in the previous<br />
secti<strong>on</strong> in Table 4‐8, column 3. To remind you,<br />
over the 1961-1990 baseline, the optimistic<br />
<str<strong>on</strong>g>climate</str<strong>on</strong>g> <str<strong>on</strong>g>change</str<strong>on</strong>g> Scenario models a 1.7ºC warming<br />
through 2050 and a 10 % increase in precipitati<strong>on</strong><br />
for the optimistic Scenario; the pessimistic<br />
Scenario models 2.7ºC warming through 2050<br />
and a 20 % decrease in precipitati<strong>on</strong>; while the<br />
middle of the road (MOR) scenario models<br />
2.2 o C warming through 2050 and a 5% increase<br />
in precipitati<strong>on</strong>. Many if not all of the Emirate’s<br />
water shortage issues are demand driven, so we<br />
have modeled adaptati<strong>on</strong> strategies accordingly<br />
while operating in the c<strong>on</strong>text of possible<br />
<str<strong>on</strong>g>climate</str<strong>on</strong>g> <str<strong>on</strong>g>change</str<strong>on</strong>g>s by 2050.<br />
5.1. Water Demand<br />
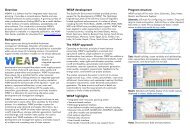
Figure 5‐1 shows the total annual water demand<br />
projecti<strong>on</strong>s for all Scenarios through the end<br />
of the simulati<strong>on</strong> period (2050). The total<br />
water demand is computed as a requirement,<br />
but does not necessarily reflect the amount of<br />
water supplied to meet those demands. Total<br />
demand ranged from a low about 4,000 Mm 3 for<br />
the Optimistic Scenario with adaptati<strong>on</strong> (2.1)<br />
to more than 18,000 Mm 3 for the Reference<br />
Scenario, where populati<strong>on</strong> growth, per-capita<br />
water use and amenity, forestry, and agriculture<br />
water use patterns remain at current levels<br />
through the full simulati<strong>on</strong> period. While the<br />
Reference Scenario is highly unlikely, it does<br />
suggest an upper bound <strong>on</strong> future water needs<br />
if there were no policy interventi<strong>on</strong>s.<br />
The Optimistic Scenario (1) suggests a future<br />
ADE populati<strong>on</strong> of nearly 7,000,000 by 2050,<br />
requiring more than 5,000 Mm3 of water annually.<br />
Despite reducti<strong>on</strong>s in per-capita water use<br />
assumed in the Optimistic Scenarios, overall<br />
water demand increases, driven by populati<strong>on</strong><br />
growth in the M&I sector. The Optimistic<br />
Scenario with adaptati<strong>on</strong> (1.1) suggests that<br />
future total water demand could be kept near<br />
current levels even with substantial populati<strong>on</strong><br />
growth. Reducti<strong>on</strong>s in water demand from the<br />
three big outdoor users (agriculture, amenity<br />
and forests) saves more than 1,000 Mm 3 per year<br />
when compared to the Optimistic Scenarios<br />
without these adaptati<strong>on</strong>s. Future <str<strong>on</strong>g>climate</str<strong>on</strong>g><br />
<str<strong>on</strong>g>change</str<strong>on</strong>g> in the Optimistic Scenarios results in<br />
a relatively small increase in water demand of<br />
about 3% by 2050 (1.2), and thus a comparis<strong>on</strong><br />
of all three Optimistic Scenarios suggests that<br />
societal adaptati<strong>on</strong>s to reducing water demand<br />
will likely be more important than future<br />
warming.<br />
Impacts, Vulnerability & Adaptati<strong>on</strong> for<br />
Water Resources in Abu Dhabi<br />
Scenarios of Future Annual Water Demand for the ADE<br />
Figure 5‐1. Total annual water demand estimates for the nine Scenarios.<br />
117