climate change on UAE - Stockholm Environment Institute-US Center
climate change on UAE - Stockholm Environment Institute-US Center
climate change on UAE - Stockholm Environment Institute-US Center

You also want an ePaper? Increase the reach of your titles
YUMPU automatically turns print PDFs into web optimized ePapers that Google loves.
2. Sea-level Rise Impacts<br />
<strong>on</strong> Coastal Systems<br />
Coastal z<strong>on</strong>es are <strong>on</strong>e of the most vulnerable<br />
areas to <str<strong>on</strong>g>climate</str<strong>on</strong>g> <str<strong>on</strong>g>change</str<strong>on</strong>g> given the increased<br />
certainty of a rise in mean sea level. As menti<strong>on</strong>ed<br />
earlier, the IPCC’s Fourth Assessment Report,<br />
posits an upper boundary for global sea-level<br />
rise by 2100 of 0.59m. Bey<strong>on</strong>d 2100, sea level<br />
rise projecti<strong>on</strong>s are increasingly dependent<br />
<strong>on</strong> emissi<strong>on</strong>s scenarios (IPCC, 2007). Sea level<br />
<str<strong>on</strong>g>change</str<strong>on</strong>g>s are induced by both natural factors<br />
such as changing ocean basin volume and<br />
depth as the earth’s plates separate and collide<br />
with each other, as well as deglaciati<strong>on</strong> from<br />
anthropogenic global warming.<br />
Taking a step back to clarify the terms used,<br />
mean sea level (MSL) is the average level of the<br />
sea’s surface, as measured relative to a fixed<br />
level <strong>on</strong> the land. MSL is typically calculated<br />
over l<strong>on</strong>g periods, usually averaged over the 19<br />
year lunar cycle as it smoothes tidal variati<strong>on</strong>s.<br />
There are seas<strong>on</strong>al or annual <str<strong>on</strong>g>change</str<strong>on</strong>g>s in MSL<br />
in additi<strong>on</strong> to gradual increases in MSL that<br />
scientists have tracked over time.<br />
Deglaciati<strong>on</strong> of c<strong>on</strong>tinental ice caps, in<br />
particular, can <str<strong>on</strong>g>change</str<strong>on</strong>g> sea level by tens of<br />
meters (Emery and Aubrey, 1991). Deglaciati<strong>on</strong><br />
<str<strong>on</strong>g>change</str<strong>on</strong>g>s the volume of water in the ocean,<br />
which is known as a eustatic sea level <str<strong>on</strong>g>change</str<strong>on</strong>g>.<br />
The IPCC estimates, however, do not include<br />
ice-sheet dynamics even though over a l<strong>on</strong>g<br />
time frame, more than 10 meters of sea-level<br />
rise is possible, depending <strong>on</strong> the emissi<strong>on</strong><br />
scenario and assumpti<strong>on</strong>s regarding ice-sheet<br />
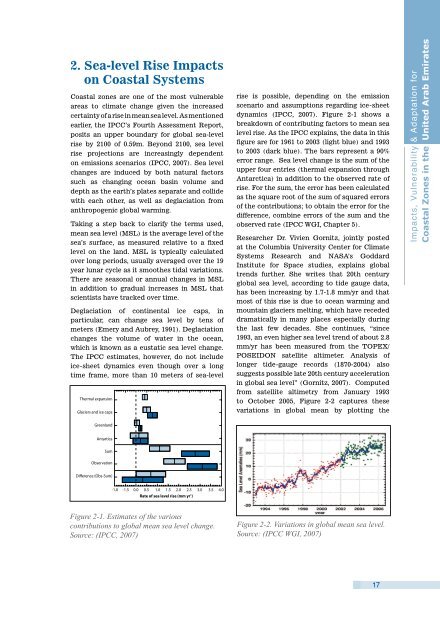
dynamics (IPCC, 2007). Figure 2-1 shows a<br />
breakdown of c<strong>on</strong>tributing factors to mean sea<br />
level rise. As the IPCC explains, the data in this<br />
figure are for 1961 to 2003 (light blue) and 1993<br />
to 2003 (dark blue). The bars represent a 90%<br />
error range. Sea level <str<strong>on</strong>g>change</str<strong>on</strong>g> is the sum of the<br />
upper four entries (thermal expansi<strong>on</strong> through<br />
Antarctica) in additi<strong>on</strong> to the observed rate of<br />
rise. For the sum, the error has been calculated<br />
as the square root of the sum of squared errors<br />
of the c<strong>on</strong>tributi<strong>on</strong>s; to obtain the error for the<br />
difference, combine errors of the sum and the<br />
observed rate (IPCC WGI, Chapter 5).<br />
Researcher Dr. Vivien Gornitz, jointly posted<br />
at the Columbia University <strong>Center</strong> for Climate<br />
Systems Research and NASA’s Goddard<br />
<strong>Institute</strong> for Space studies, explains global<br />
trends further. She writes that 20th century<br />
global sea level, according to tide gauge data,<br />
has been increasing by 1.7-1.8 mm/yr and that<br />
most of this rise is due to ocean warming and<br />
mountain glaciers melting, which have receded<br />
dramatically in many places especially during<br />
the last few decades. She c<strong>on</strong>tinues, “since<br />
1993, an even higher sea level trend of about 2.8<br />
mm/yr has been measured from the TOPEX/<br />
POSEIDON satellite altimeter. Analysis of<br />
l<strong>on</strong>ger tide-gauge records (1870-2004) also<br />
suggests possible late 20th century accelerati<strong>on</strong><br />
in global sea level” (Gornitz, 2007). Computed<br />
from satellite altimetry from January 1993<br />
to October 2005, Figure 2‐2 captures these<br />
variati<strong>on</strong>s in global mean by plotting the<br />
Impacts, Vulnerability & Adaptati<strong>on</strong> for<br />
Coastal Z<strong>on</strong>es in the United Arab Emirates<br />
Figure 2-1. Estimates of the various<br />
c<strong>on</strong>tributi<strong>on</strong>s to global mean sea level <str<strong>on</strong>g>change</str<strong>on</strong>g>.<br />
Source: (IPCC, 2007)<br />
Figure 2‐2. Variati<strong>on</strong>s in global mean sea level.<br />
Source: (IPCC WGI, 2007)<br />
17