PAD - LGED
PAD - LGED
PAD - LGED

You also want an ePaper? Increase the reach of your titles
YUMPU automatically turns print PDFs into web optimized ePapers that Google loves.
most significant of all benefits resulting from rural transport infrastructure projects. It therefore<br />
becomes essential to attempt to measure the impact of projects on the generation of this type of<br />
benefit.<br />
10. A lack of adequate information on average household income levels for small<br />
administrative areas has in the past prevented measurement of the income increasing benefits of<br />
local infrastructure projects. However, for the purposes of the RTIP-II project, raw data from the<br />
2005 Household Income and Expenditure Survey were accessed in order to generate estimates of<br />
average household income by upazila in 2005 16 . These data was then extrapolated for 2011 using<br />
GDP growth rate and inflation price index.<br />
11. In addition, sufficient data have now been collected in relation to the income-increasing<br />
impacts of earlier or on-going projects to provide guidance for the estimation of such benefits in<br />
this and future projects. For example, both the Long-run Socio-Economic Impact Study of<br />
RRMIMP II 17 and the Socio-Economic Monitoring and Evaluation (SEME) Report of RTIP-<br />
I 18 contain detailed assessments of the impact of rural transport infrastructure projects on poverty<br />
reduction, employment and income generation.<br />
12. In particular, the SEME study for RTIP-I uses baseline and post-implementation project<br />
and control data to measure the impact of the project on average family income and expenditure<br />
in the project area. The report of this study also provides an assessment of the employment<br />
generating impact of the project, both in terms of the direct employment associated with the<br />
construction and maintenance of infrastructure projects and the indirect employment induced by<br />
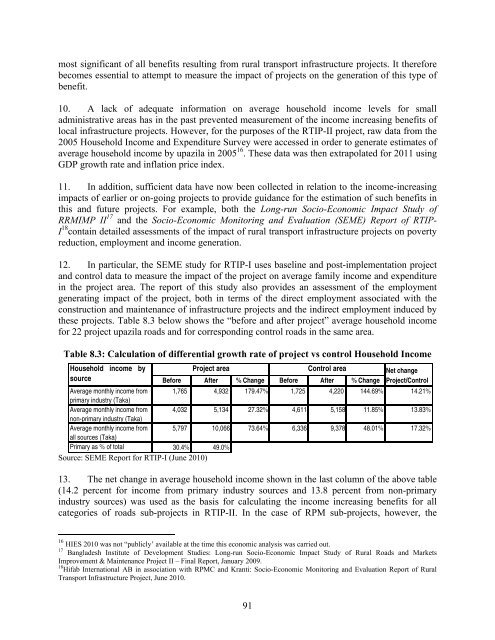
these projects. Table 8.3 below shows the “before and after project” average household income<br />
for 22 project upazila roads and for corresponding control roads in the same area.<br />
Table 8.3: Calculation of differential growth rate of project vs control Household Income<br />
Household income by<br />
source<br />
Project area<br />
Control area<br />
Net change<br />
Before After % Change Before After % Change Project/Control<br />
Average monthly income from 1,765 4,932 179.47% 1,725 4,220 144.69% 14.21%<br />
primary industry (Taka)<br />
Average monthly income from 4,032 5,134 27.32% 4,611 5,158 11.85% 13.83%<br />
non-primary industry (Taka)<br />
Average monthly income from 5,797 10,066 73.64% 6,336 9,378 48.01% 17.32%<br />
all sources (Taka)<br />
Primary as % of total 30.4% 49.0%<br />
Source: SEME Report for RTIP-I (June 2010)<br />
13. The net change in average household income shown in the last column of the above table<br />
(14.2 percent for income from primary industry sources and 13.8 percent from non-primary<br />
industry sources) was used as the basis for calculating the income increasing benefits for all<br />
categories of roads sub-projects in RTIP-II. In the case of RPM sub-projects, however, the<br />
16 HIES 2010 was not “publicly’ available at the time this economic analysis was carried out.<br />
17 Bangladesh Institute of Development Studies: Long-run Socio-Economic Impact Study of Rural Roads and Markets<br />
Improvement & Maintenance Project II – Final Report, January 2009.<br />
18 Hifab International AB in association with RPMC and Kranti: Socio-Economic Monitoring and Evaluation Report of Rural<br />
Transport Infrastructure Project, June 2010.<br />
91