Statistics Book 2007.pdf - Kerala Tourism
Statistics Book 2007.pdf - Kerala Tourism
Statistics Book 2007.pdf - Kerala Tourism

Create successful ePaper yourself
Turn your PDF publications into a flip-book with our unique Google optimized e-Paper software.
• About 63 to 77% of the tourists arranged the tour program by themselves and about 14-20%<br />
through tour and travel agents. 4-10% came with the help of their friends.<br />
• For about 36 to 40% of tourists, the stay was in the range of 6-10 days and for about 16 to 32% it<br />
was in the range of 11-15 days. The average length of stay is 16 days for 2004-05 and 15 days for<br />
the years 2005-06 and 2006-07.<br />
• On an average, all tourists of first year sample expect to spend 6 nights in the first destination<br />
(cities) of their travel and the corresponding figures for second and third years are 7 and 8<br />
respectively.<br />
• For intra <strong>Kerala</strong> travel, Taxi was used for 21-49% of the tourists’ trips and. Public transport like<br />
train and KSRTC were used by nearly 34-49% of the trips.<br />
• About 46-72% of the tourists stayed in star hotels and resorts, while 22-38% of the tourists stayed<br />
at non classified hotels. Other accommodation facilities are used by only very few visitors.<br />
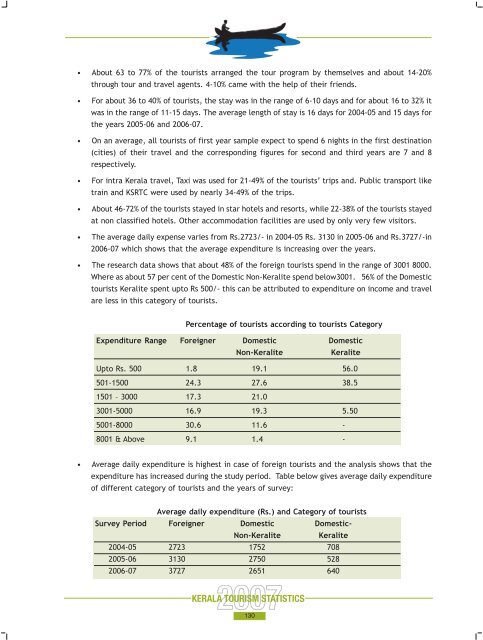
• The average daily expense varies from Rs.2723/- in 2004-05 Rs. 3130 in 2005-06 and Rs.3727/-in<br />
2006-07 which shows that the average expenditure is increasing over the years.<br />
• The research data shows that about 48% of the foreign tourists spend in the range of 3001 8000.<br />
Where as about 57 per cent of the Domestic Non-Keralite spend below3001. 56% of the Domestic<br />
tourists Keralite spent upto Rs 500/- this can be attributed to expenditure on income and travel<br />
are less in this category of tourists.<br />
Percentage of tourists according to tourists Category<br />
Expenditure Range Foreigner Domestic Domestic<br />
Non-Keralite<br />
Keralite<br />
Upto Rs. 500 1.8 19.1 56.0<br />
501-1500 24.3 27.6 38.5<br />
1501 – 3000 17.3 21.0<br />
3001-5000 16.9 19.3 5.50<br />
5001-8000 30.6 11.6 -<br />
8001 & Above 9.1 1.4 -<br />
• Average daily expenditure is highest in case of foreign tourists and the analysis shows that the<br />
expenditure has increased during the study period. Table below gives average daily expenditure<br />
of different category of tourists and the years of survey:<br />
Average daily expenditure (Rs.) and Category of tourists<br />
Survey Period Foreigner Domestic Domestic-<br />
Non-Keralite Keralite<br />
2004-05 2723 1752 708<br />
2005-06 3130 2750 528<br />
2006-07 3727 2651 640<br />
130