Statistics Book 2007.pdf - Kerala Tourism
Statistics Book 2007.pdf - Kerala Tourism
Statistics Book 2007.pdf - Kerala Tourism

You also want an ePaper? Increase the reach of your titles
YUMPU automatically turns print PDFs into web optimized ePapers that Google loves.
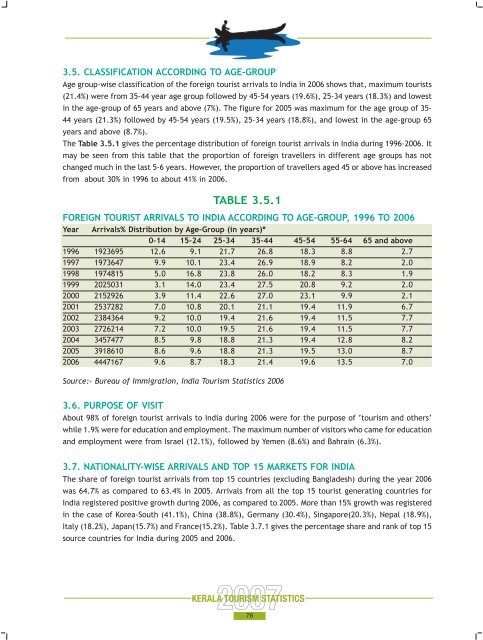
3.5. CLASSIFICATION ACCORDING TO AGE-GROUP<br />
Age group-wise classification of the foreign tourist arrivals to India in 2006 shows that, maximum tourists<br />
(21.4%) were from 35-44 year age group followed by 45-54 years (19.6%), 25-34 years (18.3%) and lowest<br />
in the age-group of 65 years and above (7%). The figure for 2005 was maximum for the age group of 35-<br />
44 years (21.3%) followed by 45-54 years (19.5%), 25-34 years (18.8%), and lowest in the age-group 65<br />
years and above (8.7%).<br />
The Table 3.5.1 gives the percentage distribution of foreign tourist arrivals in India during 1996-2006. It<br />
may be seen from this table that the proportion of foreign travellers in different age groups has not<br />
changed much in the last 5-6 years. However, the proportion of travellers aged 45 or above has increased<br />
from about 30% in 1996 to about 41% in 2006.<br />
TABLE 3.5.1<br />
FOREIGN TOURIST ARRIVALS TO INDIA ACCORDING TO AGE-GROUP, 1996 TO 2006<br />
Year Arrivals% Distribution by Age-Group (in years)*<br />
0-14 15-24 25-34 35-44 45-54 55-64 65 and above<br />
1996 1923695 12.6 9.1 21.7 26.8 18.3 8.8 2.7<br />
1997 1973647 9.9 10.1 23.4 26.9 18.9 8.2 2.0<br />
1998 1974815 5.0 16.8 23.8 26.0 18.2 8.3 1.9<br />
1999 2025031 3.1 14.0 23.4 27.5 20.8 9.2 2.0<br />
2000 2152926 3.9 11.4 22.6 27.0 23.1 9.9 2.1<br />
2001 2537282 7.0 10.8 20.1 21.1 19.4 11.9 6.7<br />
2002 2384364 9.2 10.0 19.4 21.6 19.4 11.5 7.7<br />
2003 2726214 7.2 10.0 19.5 21.6 19.4 11.5 7.7<br />
2004 3457477 8.5 9.8 18.8 21.3 19.4 12.8 8.2<br />
2005 3918610 8.6 9.6 18.8 21.3 19.5 13.0 8.7<br />
2006 4447167 9.6 8.7 18.3 21.4 19.6 13.5 7.0<br />
Source:- Bureau of Immigration, India <strong>Tourism</strong> <strong>Statistics</strong> 2006<br />
3.6. PURPOSE OF VISIT<br />
About 98% of foreign tourist arrivals to India during 2006 were for the purpose of ‘tourism and others’<br />
while 1.9% were for education and employment. The maximum number of visitors who came for education<br />
and employment were from Israel (12.1%), followed by Yemen (8.6%) and Bahrain (6.3%).<br />
3.7. NATIONALITY-WISE ARRIVALS AND TOP 15 MARKETS FOR INDIA<br />
The share of foreign tourist arrivals from top 15 countries (excluding Bangladesh) during the year 2006<br />
was 64.7% as compared to 63.4% in 2005. Arrivals from all the top 15 tourist generating countries for<br />
India registered positive growth during 2006, as compared to 2005. More than 15% growth was registered<br />
in the case of Korea-South (41.1%), China (38.8%), Germany (30.4%), Singapore(20.3%), Nepal (18.9%),<br />
Italy (18.2%), Japan(15.7%) and France(15.2%). Table 3.7.1 gives the percentage share and rank of top 15<br />
source countries for India during 2005 and 2006.<br />
76