- Page 2:
Government of Kerala Department of
- Page 5 and 6:
KODIYERI BALAKRISHNAN MINISTER FOR
- Page 8 and 9:
CONTENTS Page no CHAPTER 1 13 IMPOR
- Page 10 and 11:
CHAPTER 9 107 HUMAN RESOURCE DEVELO
- Page 12 and 13:
OFFICERS ASSOCIATED WITH THE PREPAR
- Page 14:
CHAPTER 1 Important Statistics on K
- Page 17 and 18:
Kerala’s Share in the National Po
- Page 19 and 20:
2008 Highlights TOURIST STATISTICS
- Page 21 and 22:
GOVERNMENT OF KERALA - DEPARTMENT O
- Page 24:
CHAPTER 2 Kerala Tourism
- Page 27 and 28:
KERALA - WHERE THE VERDANT GREEN CA
- Page 29 and 30:
to monitor current activities and t
- Page 31 and 32:
· International Convention Centre
- Page 33 and 34:
· ATM Dubai · ILTM France · WTM
- Page 35 and 36:
2.3. DISTRICT-WISE AND MONTH-WISE S
- Page 37 and 38:
2.4. TOTAL NUMBER OF TOURISTS The f
- Page 39 and 40:
MONTH-WISE DETAILS OF FOREIGN TOURI
- Page 41 and 42:
FOREIGN TOURIST ARRIVALS - DISTRICT
- Page 43 and 44:
TABLE 2.4.7 MONTH-WISE FOREIGN TOUR
- Page 45 and 46:
DOMESTIC TOURISTS Domestic tourist
- Page 47 and 48:
TABLE 2.4.10 DOMESTIC TOURIST ARRIV
- Page 49 and 50:
TABLE 2.4.12 MONTH-WISE DOMESTIC TO
- Page 51 and 52:
TABLE 2.4.13 DESTINATION-WISE-NATIO
- Page 53 and 54:
TABLE 2.4.13 DESTINATION-WISE-NATIO
- Page 55 and 56:
2.5 TOURIST ARRIVALS: 1996 - 2007 T
- Page 57 and 58:
TABLE 2.5.3 DOMESTIC TOURIST ARRIVA
- Page 59 and 60:
TABLE 2.5.6 FINANCIAL YEAR-WISE TOU
- Page 61 and 62:
TABLE 2.7.2 NATIONALITY-WISE ARRIVA
- Page 63 and 64:
TABLE 2.8.2 RANKING OF COUNTRIES AC
- Page 65 and 66:
2.11. MONTH-WISE DETAILS OF FOREIGN
- Page 67 and 68:
TABLE 2.12.2 FOREIGN EXCHANGE EARNI
- Page 69 and 70:
Prestigious awards that came Kerala
- Page 72 and 73:
CHAPTER 3 Inbound Tourism - Foreign
- Page 74 and 75:
3.2 FOREIGN TOURIST ARRIVALS TO IND
- Page 76 and 77:
3.4. PORT OF ENTRY During 2006, the
- Page 78 and 79:
TABLE 3.7.1 TOP 15 SOURCE COUNTRIES
- Page 80 and 81:
TABLE 3.7.3 FOREIGN EXCHANGE EARNIN
- Page 82:
CHAPTER 4 World Tourism Scenario an
- Page 85 and 86:
TABLE 4.1.2 COUNTRIES WHICH ARE ABO
- Page 87 and 88:
TABLE 4.2.2 INTERNATIONAL TOURISM R
- Page 90:
CHAPTER 5 Outbound Tourism Indian N
- Page 93 and 94:
TABLE 5.1.2 PORT-WISE DEPARTURES OF
- Page 96 and 97:
Domestic Tourism in India The compi
- Page 98:
CHAPTER 7 Approved Hotels 97
- Page 101 and 102:
ACCOMMODATION OF FOREIGN TOURISTS T
- Page 103 and 104:
Abstract List of Approved Health Ce
- Page 106 and 107:
8.1 TRAVEL AGENTS, TOUR OPERATORS A
- Page 108:
CHAPTER 9 Human Resource Developmen
- Page 111 and 112:
Diploma in Air Hostess, Travel and
- Page 113 and 114:
SHORT TERM COURSES: Sl Course Title
- Page 115 and 116:
I. INSTITUTE OF HOTEL MANAGEMENT 1.
- Page 118 and 119: TABLE10.1.1 ANNUAL PLAN OUTLAY (200
- Page 120 and 121: TABLE 10.1.3 NON - PLAN ALLOCATION
- Page 122 and 123: Table 10.1.5 Department of Tourism
- Page 124: TABLE 10.1.7 STATE-WISE TOURISM PRO
- Page 128 and 129: Kerala Tourism conducts various stu
- Page 130 and 131: Tourist’s trends • Kerala recor
- Page 132 and 133: • Accommodation accounts for abou
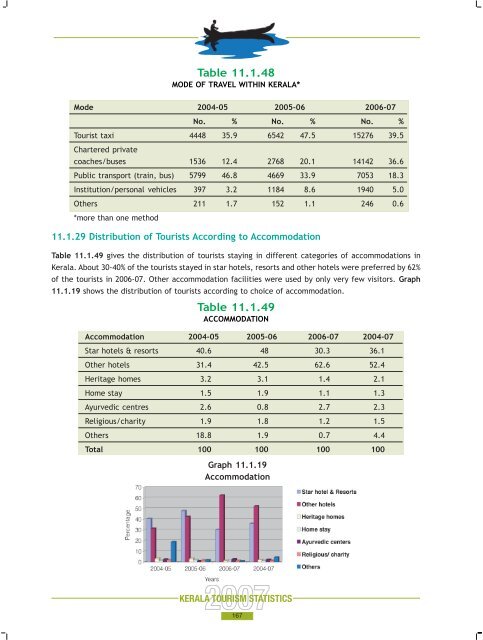
- Page 134 and 135: • Nearly 34-52% of the tourists s
- Page 136 and 137: 6. Tourism Satellite Accounting wil
- Page 138 and 139: 44. Data warehousing and data minin
- Page 140 and 141: Sampling criteria /features include
- Page 142 and 143: 11.1.3 Educational Qualifications T
- Page 144 and 145: 11.1.6 Mode of Travel to Kerala Tab
- Page 146 and 147: Table 11.1.9 FREQUENCY OF VISIT TO
- Page 148 and 149: Table 11.1.14 AVAILABILITY OF AYURV
- Page 150 and 151: Table 11.1.19 OCCUPATIONAL PROFILE
- Page 152 and 153: Table 11.1.22 EXPECTED NO. OF DAYS
- Page 154 and 155: Table 11.1.26 EXPECTED AVERAGE NIGH
- Page 156 and 157: Graph 11.1.10 Percentage of Tourist
- Page 158 and 159: 11.1.16 Return Journey Table 11.1.3
- Page 160 and 161: Table 11.1.36 gives the percentage
- Page 162 and 163: Table 11.1.38 EDUCATIONAL QUALIFICA
- Page 164 and 165: Table 11.1.41 MODE OF ARRIVAL TO KE
- Page 166 and 167: Graph 11.1.17 Specific Purpose of V
- Page 170 and 171: Table 11.1.51 DESTINATION FROM KERA
- Page 172 and 173: 11.1.33 Age Distribution The distri
- Page 174 and 175: Table 11.1.58 NO. OF PERSONS ACCOMP
- Page 176 and 177: Table 11.1.61 MODE OF TRAVEL Mode 2
- Page 178 and 179: Table 11.1.65 gives the percentage
- Page 180 and 181: 11.1.42 Domestic and Foreign Touris
- Page 182 and 183: • Identify type of food available
- Page 184 and 185: E. Business Travel & MICE Tourism:
- Page 186 and 187: The hotels in Kerala are smart and
- Page 188 and 189: F. Suggestions for improvements in
- Page 190 and 191: Years Average Occupancy Percentage
- Page 192 and 193: and Hoteliers is very active in Koc
- Page 194 and 195: Projected Annual Demand vs. Supply
- Page 196 and 197: of niche tourism products and marke
- Page 198 and 199: were designed for all segments and
- Page 200 and 201: It is a well accepted fact that dur
- Page 202: Energy use is another field we exam
- Page 206 and 207: 12.1 FINANCIAL ASSISTANCE PROVIDED
- Page 208 and 209: APPENDICES 207
- Page 210 and 211: 8) Central and South America compri
- Page 212 and 213: Appendix II IMPORTANT TOURIST DESTI
- Page 214 and 215: ANNEXURES 213
- Page 216 and 217: 21 Estuary Island (A Unit of Thomas
- Page 218 and 219:
68 Pagoda Resorts, CCNB Road, Kallu
- Page 220 and 221:
113 Gogulam Park Inn International,
- Page 222 and 223:
164 The Malabar House, Fort Cochin,
- Page 224 and 225:
207 Malabar Heritage (A Unit of KMA
- Page 226 and 227:
225 ANNEXURE II DEPARTMENT OF TOURI
- Page 228 and 229:
227 24 “ SECOND HOME 4 U” Shri.
- Page 230 and 231:
229 5 “MANKULANGARA HOMESTAY” S
- Page 232 and 233:
231 26 “NEDIYA PARAMBIL” Shri.
- Page 234 and 235:
233 10 “EVERGREEN BUNGALOW” Shr
- Page 236 and 237:
235 40 “NUTMUG COUNTY” Shri. P.
- Page 238 and 239:
237 72 “SANTHI THEERAM HERITAGE H
- Page 240 and 241:
239 25 “MASHROOM VALLEY” Shri.
- Page 242 and 243:
241 55 “”DREAM LAND” Shri. M.
- Page 244 and 245:
243 87 “MODAYIL TEA TRES” Shri.
- Page 246 and 247:
245 19 CHANDINI Smt. Rejeenamole S,
- Page 248 and 249:
247 49 “VASCO HOME STAY” Shri.
- Page 250 and 251:
249 13 “ITTYS” Shri. Antony Pal
- Page 252 and 253:
251 6 “GREEN WOOD” Shri. K.T.Gu
- Page 254 and 255:
253 KANNUR 1 “SHREDDHA” Dr.A.K.
- Page 256 and 257:
255 8 Shri.Sanil Kumar.K.R, Kandath
- Page 258 and 259:
257 14 M/s Kerala Bamboo House Ayur
- Page 260 and 261:
259 7 M/s. Vedasparsh, Back Water R
- Page 262 and 263:
261 4 M/s. Sitaram Ayurveda Special
- Page 264 and 265:
1.GREEN FARMS KERALA Annexure V NEW
- Page 266 and 267:
■ ■ ■ ■ Adventure Tourism i
- Page 268 and 269:
APPLICATION PROFORMA FOR THE APPROV
- Page 270 and 271:
PROFORMA FOR ACCEPTANCE OF REGULATO
- Page 272 and 273:
17. Tourist Information Counter, Ra
- Page 274 and 275:
panickerstravel@sanchar.net.in Pooj
- Page 276 and 277:
2422893 Email: safiyatravelstirur@h
- Page 278 and 279:
Shri. T.P.Narayanankutty IFS Chief
- Page 280:
PUBLIC INFORMATION OFFICERS AT DIST


