Effect of Post Metallization Annealing for La 2 O 3 Thin Film
Effect of Post Metallization Annealing for La 2 O 3 Thin Film
Effect of Post Metallization Annealing for La 2 O 3 Thin Film

You also want an ePaper? Increase the reach of your titles
YUMPU automatically turns print PDFs into web optimized ePapers that Google loves.
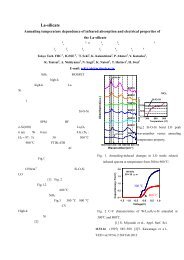
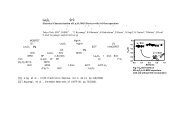
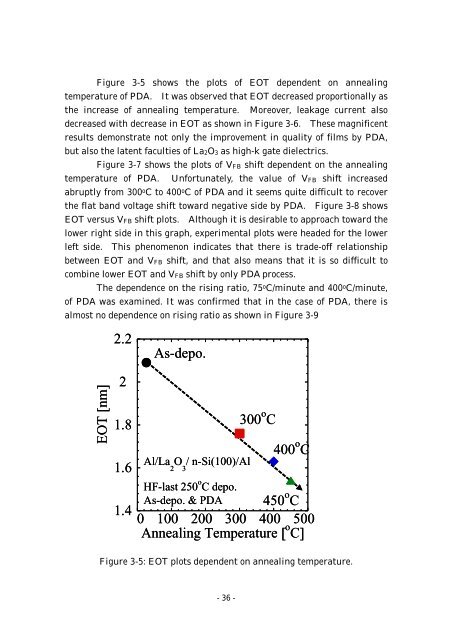
Figure 3-5 shows the plots <strong>of</strong> EOT dependent on annealingtemperature <strong>of</strong> PDA. It was observed that EOT decreased proportionally asthe increase <strong>of</strong> annealing temperature. Moreover, leakage current alsodecreased with decrease in EOT as shown in Figure 3-6. These magnificentresults demonstrate not only the improvement in quality <strong>of</strong> films by PDA,but also the latent faculties <strong>of</strong> <strong>La</strong>2O3 as high-k gate dielectrics.Figure 3-7 shows the plots <strong>of</strong> VFB shift dependent on the annealingtemperature <strong>of</strong> PDA. Un<strong>for</strong>tunately, the value <strong>of</strong> VFB shift increasedabruptly from 300 o C to 400 o C <strong>of</strong> PDA and it seems quite difficult to recoverthe flat band voltage shift toward negative side by PDA. Figure 3-8 showsEOT versus VFB shift plots. Although it is desirable to approach toward thelower right side in this graph, experimental plots were headed <strong>for</strong> the lowerleft side. This phenomenon indicates that there is trade-<strong>of</strong>f relationshipbetween EOT and VFB shift, and that also means that it is so difficult tocombine lower EOT and VFB shift by only PDA process.The dependence on the rising ratio, 75 o C/minute and 400 o C/minute,<strong>of</strong> PDA was examined. It was confirmed that in the case <strong>of</strong> PDA, there isalmost no dependence on rising ratio as shown in Figure 3-9EOT [nm]2.221.81.61.4As-depo.300 o CAl/<strong>La</strong> O / n-Si(100)/Al2 3HF-last 250 o C depo.400 o CAs-depo. & PDA450 o C0 100 200 300 400 500<strong>Annealing</strong> Temperature [ o C]Figure 3-5: EOT plots dependent on annealing temperature.- 36 -