Quantitative structural analyses and numerical modelling of ...
Quantitative structural analyses and numerical modelling of ...
Quantitative structural analyses and numerical modelling of ...

You also want an ePaper? Increase the reach of your titles
YUMPU automatically turns print PDFs into web optimized ePapers that Google loves.
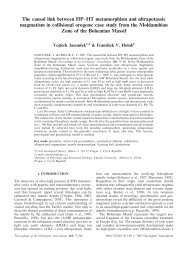
DTD 5ARTICLE IN PRESS18L. Baratoux et al. / Journal <strong>of</strong> Structural Geology xx (xxxx) 1–24Fig. 11. Plot <strong>of</strong> grain boundary preferred orientation (GBPO) <strong>of</strong> amphibole–amphibole, amphibole–plagioclase <strong>and</strong> plagioclase–plagioclase boundariesdisplaying weighted ratio <strong>of</strong> eigenvalues <strong>of</strong> inertia. The numbers represent the orientation <strong>of</strong> the eigenvector V 1 <strong>of</strong> GBPO with respect to the horizontal.Positive values indicate anticlockwise deviation. Samples from the pluton aureole are labelled Sil*.factor controlling the mode <strong>and</strong> style <strong>of</strong> folding <strong>of</strong> amineral fabric is the mechanical anisotropy <strong>of</strong> thematerial <strong>and</strong> this is defined by the ratio <strong>of</strong> two moduli,one a measure <strong>of</strong> the resistance to layer or fabricparallel compression (M) <strong>and</strong> the other to the resistanceto shear in the same direction (L).It can be shown that there is a direct link betweenthe anisotropy (M/L) <strong>and</strong> the competence contrast <strong>of</strong> abilaminate (m 1 /m 2 )(seePrice <strong>and</strong> Cosgrove, 1990) <strong>and</strong>this allows one to use both theories to study foldingbehaviour. By analysing the geometries <strong>of</strong> the studiedfolds it is possible to determine which <strong>of</strong> the twotheoretical approaches is more appropriate. As shownearlier, the low F values <strong>of</strong> the folds from the garnet(low b 1 ) <strong>and</strong> staurolite zones (high b 1 ) are similar tothose in the range type 5a <strong>and</strong> 5b to type 4b (Fig. 6).The trend <strong>of</strong> the arrows in Fig. 7b (which indicates theratio <strong>of</strong> active buckling amplification <strong>and</strong> fold flatteningin the staurolite zone) is comparable with the trendsindicated in Fig. 6 for a multilayer (type 5b) with ahigh competence contrast between adjacent layers. Theconstruction <strong>of</strong> the dip isogons for the folds from thiszone shows alternations <strong>of</strong> layers with differentgeometries (classes 1B <strong>and</strong> 1C alternating with class3) <strong>and</strong> different curvature pr<strong>of</strong>iles <strong>of</strong> the hinge regions(Fig. 12), a pattern compatible with the folds <strong>of</strong> type5b. Using the classical theory <strong>of</strong> Ramberg (1963), thispattern can be interpreted in terms <strong>of</strong> folding <strong>of</strong> amultilayer sequence marked by alternation <strong>of</strong> layerswith a high competence contrast.However, as was shown above, the garnet zoneamphibolites are more or less compositionally homogeneous<strong>and</strong> do not show distinct compositional layering.Inspection <strong>of</strong> Fig. 7a shows that the folds in the garnet zonecould be considered to represent the early stages <strong>of</strong> active<strong>and</strong> passive amplification observed in the staurolite zone.However, there is a marked difference in the density <strong>of</strong> thedata relating to the ‘competent’ <strong>and</strong> ‘incompetent’ members<strong>of</strong> the multilayer. When the pattern <strong>of</strong> dip isogons for arepresentative fold pr<strong>of</strong>ile for these folds is examined (Fig.12), it can be seen that there is an important increase <strong>of</strong> foldflattening component resulting in a convergence <strong>of</strong> shapes(<strong>and</strong> therefore dip isogon patterns) <strong>of</strong> adjacent layers.A comparison <strong>of</strong> the natural data from folds in thesillimanite zone (Fig. 7c) with the model folds in Fig. 6shows that the best fit is with type 2b folds. Thisgeometry is traditionally interpreted as indicating abilaminate with a low competence contrast. However,we note the strong asymmetry in the density <strong>of</strong> pointsindicating a lack <strong>of</strong> incompetent ‘layers’. This isconfirmed by inspection <strong>of</strong> the dip isogon pattern <strong>of</strong>representative folds from this zone (Fig. 12). Althoughthe pattern shows alternations <strong>of</strong> fold shapes <strong>of</strong> class 1Cwith those <strong>of</strong> class 3, it is obtained by analysing‘layers’ that are composed <strong>of</strong> several units. The absence<strong>of</strong> alternations <strong>of</strong> clearly defined individual layerscombined with the high degree <strong>of</strong> flattening <strong>and</strong>relatively low fold amplification indicate that thissystem approximates more closely to the model analysedby Biot than to a bilaminate.126