- Page 3: “It strikes me that all our knowl
- Page 8 and 9: Contentsviii4.7 Schulmann, Konopás
- Page 11: Dedicated to my wife Markéta, daug
- Page 14 and 15: Foreword 2First topic “Quantitati
- Page 16 and 17: Foreword 4source and freely availab
- Page 18 and 19: 1. Quantitative analysis of deforma
- Page 20 and 21: 1. Quantitative analysis of deforma
- Page 22 and 23: 1. Quantitative analysis of deforma
- Page 24 and 25: 1. Quantitative analysis of deforma
- Page 26 and 27: 1. Quantitative analysis of deforma
- Page 28 and 29: 1. Quantitative analysis of deforma
- Page 31 and 32: Chapter 2Mechanisms of lower crusta
- Page 33 and 34: 2. Mechanisms of lower crustal flow
- Page 35 and 36: 2. Mechanisms of lower crustal flow
- Page 37 and 38: 2. Mechanisms of lower crustal flow
- Page 39 and 40: 2. Mechanisms of lower crustal flow
- Page 41: Chapter 3Quantitative analyses ofme
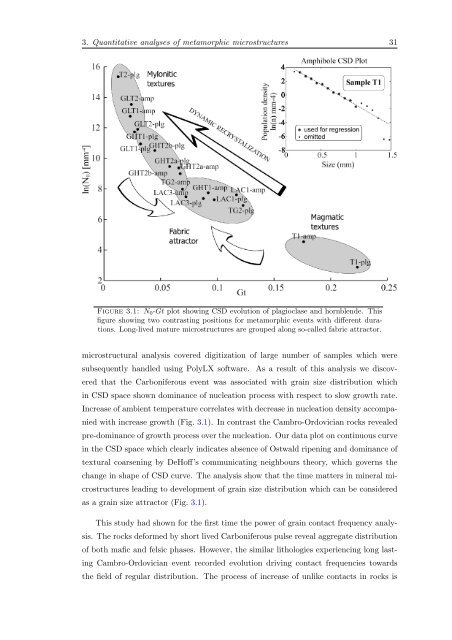
- Page 45 and 46: 3. Quantitative analyses of metamor
- Page 47 and 48: 3. Quantitative analyses of metamor
- Page 49 and 50: 3. Quantitative analyses of metamor
- Page 51: 3. Quantitative analyses of metamor
- Page 54 and 55: Bibliography 42Culshaw, N., Beaumon
- Page 56 and 57: Bibliography 44sources and trigger
- Page 58 and 59: Bibliography 46Skrzypek, E., Štíp
- Page 61 and 62: Journal of Structural Geology 23 20
- Page 63 and 64: J. KonopaÂsek et al. / Journal of
- Page 65 and 66: J. KonopaÂsek et al. / Journal of
- Page 67 and 68: J. KonopaÂsek et al. / Journal of
- Page 69 and 70: J. KonopaÂsek et al. / Journal of
- Page 71 and 72: J. KonopaÂsek et al. / Journal of
- Page 73 and 74: J. KonopaÂsek et al. / Journal of
- Page 75 and 76: J. KonopaÂsek et al. / Journal of
- Page 77 and 78: J. KonopaÂsek et al. / Journal of
- Page 79 and 80: J. KonopaÂsek et al. / Journal of
- Page 81 and 82: JOURNAL OF GEOPHYSICAL RESEARCH, VO
- Page 83 and 84: SCHULMANN ET AL.: STRAIN DISTRIBUTI
- Page 85 and 86: SCHULMANN ET AL.: STRAIN DISTRIBUTI
- Page 87 and 88: SCHULMANN ET AL.: STRAIN DISTRIBUTI
- Page 89 and 90: SCHULMANN ET AL.: STRAIN DISTRIBUTI
- Page 91 and 92: SCHULMANN ET AL.: STRAIN DISTRIBUTI
- Page 93 and 94:
SCHULMANN ET AL.: STRAIN DISTRIBUTI
- Page 95:
SCHULMANN ET AL.: STRAIN DISTRIBUTI
- Page 98 and 99:
5 - 2 LEXA ET AL.: COLLISION IN WES
- Page 100 and 101:
5 - 4 LEXA ET AL.: COLLISION IN WES
- Page 102 and 103:
5 - 6 LEXA ET AL.: COLLISION IN WES
- Page 104 and 105:
5 - 8 LEXA ET AL.: COLLISION IN WES
- Page 106 and 107:
5 - 10 LEXA ET AL.: COLLISION IN WE
- Page 108 and 109:
5 - 12 LEXA ET AL.: COLLISION IN WE
- Page 110 and 111:
5 - 14 LEXA ET AL.: COLLISION IN WE
- Page 112 and 113:
5 - 16 LEXA ET AL.: COLLISION IN WE
- Page 114 and 115:
156O. Lexa et al. / Journal of Stru
- Page 116 and 117:
158O. Lexa et al. / Journal of Stru
- Page 118 and 119:
160O. Lexa et al. / Journal of Stru
- Page 121 and 122:
DTD 5ARTICLE IN PRESSJournal of Str
- Page 123 and 124:
DTD 5ARTICLE IN PRESSL. Baratoux et
- Page 125 and 126:
DTD 5ARTICLE IN PRESSL. Baratoux et
- Page 127 and 128:
DTD 5ARTICLE IN PRESSL. Baratoux et
- Page 129 and 130:
DTD 5ARTICLE IN PRESSL. Baratoux et
- Page 131 and 132:
DTD 5ARTICLE IN PRESSL. Baratoux et
- Page 133 and 134:
DTD 5ARTICLE IN PRESSL. Baratoux et
- Page 135 and 136:
Table 1Statistical values of the qu
- Page 137 and 138:
DTD 5ARTICLE IN PRESSL. Baratoux et
- Page 139 and 140:
DTD 5ARTICLE IN PRESSL. Baratoux et
- Page 141 and 142:
Table 2Summary of parameters derive
- Page 143 and 144:
DTD 5ARTICLE IN PRESSL. Baratoux et
- Page 145 and 146:
J. metamorphic Geol., 2008, 26, 273
- Page 147 and 148:
EXHUMATION IN LARGE HOT OROGEN 275m
- Page 149 and 150:
Probabi l irequencyProbabi l ireque
- Page 151 and 152:
EXHUMATION IN LARGE HOT OROGEN 279y
- Page 153 and 154:
EXHUMATION IN LARGE HOT OROGEN 281N
- Page 155 and 156:
EXHUMATION IN LARGE HOT OROGEN 283w
- Page 157 and 158:
EXHUMATION IN LARGE HOT OROGEN 285a
- Page 159 and 160:
EXHUMATION IN LARGE HOT OROGEN 287w
- Page 161 and 162:
EXHUMATION IN LARGE HOT OROGEN 289T
- Page 163 and 164:
EXHUMATION IN LARGE HOT OROGEN 291O
- Page 165 and 166:
EXHUMATION IN LARGE HOT OROGEN 293r
- Page 167 and 168:
EXHUMATION IN LARGE HOT OROGEN 295B
- Page 169:
EXHUMATION IN LARGE HOT OROGEN 297R
- Page 172 and 173:
Author's personal copyK. Schulmann
- Page 174 and 175:
Author's personal copyK. Schulmann
- Page 176 and 177:
Author's personal copyK. Schulmann
- Page 178 and 179:
Author's personal copyK. Schulmann
- Page 180 and 181:
Author's personal copyK. Schulmann
- Page 182 and 183:
Author's personal copyK. Schulmann
- Page 184 and 185:
Author's personal copyK. Schulmann
- Page 186 and 187:
Author's personal copyK. Schulmann
- Page 188 and 189:
Author's personal copyK. Schulmann
- Page 190 and 191:
Author's personal copyK. Schulmann
- Page 193 and 194:
J. metamorphic Geol., 2011, 29, 79-
- Page 195 and 196:
HEAT SOURCES AND EXHUMATION MECHANI
- Page 197 and 198:
HEAT SOURCES AND EXHUMATION MECHANI
- Page 199 and 200:
HEAT SOURCES AND EXHUMATION MECHANI
- Page 201 and 202:
HEAT SOURCES AND EXHUMATION MECHANI
- Page 203 and 204:
HEAT SOURCES AND EXHUMATION MECHANI
- Page 205 and 206:
HEAT SOURCES AND EXHUMATION MECHANI
- Page 207 and 208:
HEAT SOURCES AND EXHUMATION MECHANI
- Page 209 and 210:
HEAT SOURCES AND EXHUMATION MECHANI
- Page 211 and 212:
HEAT SOURCES AND EXHUMATION MECHANI
- Page 213 and 214:
HEAT SOURCES AND EXHUMATION MECHANI
- Page 215 and 216:
HEAT SOURCES AND EXHUMATION MECHANI
- Page 217 and 218:
J. metamorphic Geol., 2011, 29, 53-
- Page 219 and 220:
EXTRUSIONOFLOWERCRUSTINVARISCANOROG
- Page 221 and 222:
EXTRUSIONOFLOWERCRUSTINVARISCANOROG
- Page 223 and 224:
EXTRUSIONOFLOWERCRUSTINVARISCANOROG
- Page 225 and 226:
EXTRUSIONOFLOWERCRUSTINVARISCANOROG
- Page 227 and 228:
EXTRUSIONOFLOWERCRUSTINVARISCANOROG
- Page 229 and 230:
EXTRUSIONOFLOWERCRUSTINVARISCANOROG
- Page 231 and 232:
EXTRUSIONOFLOWERCRUSTINVARISCANOROG
- Page 233 and 234:
EXTRUSIONOFLOWERCRUSTINVARISCANOROG
- Page 235 and 236:
EXTRUSIONOFLOWERCRUSTINVARISCANOROG
- Page 237 and 238:
EXTRUSIONOFLOWERCRUSTINVARISCANOROG
- Page 239 and 240:
EXTRUSIONOFLOWERCRUSTINVARISCANOROG
- Page 241 and 242:
EXTRUSIONOFLOWERCRUSTINVARISCANOROG
- Page 243 and 244:
J. metamorphic Geol., 2005, 23, 649
- Page 245 and 246:
CONTRASTING TEXTURAL RECORD OF TWO
- Page 247 and 248:
CONTRASTING TEXTURAL RECORD OF TWO
- Page 249 and 250:
CONTRASTING TEXTURAL RECORD OF TWO
- Page 251 and 252:
CONTRASTING TEXTURAL RECORD OF TWO
- Page 253 and 254:
CONTRASTING TEXTURAL RECORD OF TWO
- Page 255 and 256:
CONTRASTING TEXTURAL RECORD OF TWO
- Page 257 and 258:
CONTRASTING TEXTURAL RECORD OF TWO
- Page 259 and 260:
CONTRASTING TEXTURAL RECORD OF TWO
- Page 261 and 262:
Contrasting microstructures and def
- Page 263 and 264:
TEXTURES OF NATURALLY DEFORMED META
- Page 265 and 266:
TEXTURES OF NATURALLY DEFORMED META
- Page 267 and 268:
TEXTURES OF NATURALLY DEFORMED META
- Page 269 and 270:
TEXTURES OF NATURALLY DEFORMED META
- Page 271 and 272:
TEXTURES OF NATURALLY DEFORMED META
- Page 273 and 274:
1.0--0.9__Mg~(Mg2++Fe2+)9 Core of p
- Page 275 and 276:
TEXTURES OF NATURALLY DEFORMED META
- Page 277 and 278:
' ~'-----2~--~----TEXTURES OF NATUR
- Page 279 and 280:
TEXTURES OF NATURALLY DEFORMED META
- Page 281 and 282:
TEXTURES OF NATURALLY DEFORMED META
- Page 283 and 284:
TEXTURES OF NATURALLY DEFORMED META
- Page 285 and 286:
TEXTURES OF NATURALLY DEFORMED META
- Page 287 and 288:
TEXTURES OF NATURALLY DEFORMED META
- Page 289:
TEXTURES OF NATURALLY DEFORMED META
- Page 292 and 293:
B10210ZÁVADA ET AL.: EXTREME DUCTI
- Page 294 and 295:
B10210ZÁVADA ET AL.: EXTREME DUCTI
- Page 296 and 297:
B10210ZÁVADA ET AL.: EXTREME DUCTI
- Page 298 and 299:
B10210ZÁVADA ET AL.: EXTREME DUCTI
- Page 300 and 301:
B10210ZÁVADA ET AL.: EXTREME DUCTI
- Page 302 and 303:
B10210ZÁVADA ET AL.: EXTREME DUCTI
- Page 304 and 305:
B10210ZÁVADA ET AL.: EXTREME DUCTI
- Page 307 and 308:
ClickHereforFullArticleJOURNAL OF G
- Page 309 and 310:
B10406SCHULMANN ET AL.: RHEOLOGY OF
- Page 311 and 312:
B10406SCHULMANN ET AL.: RHEOLOGY OF
- Page 313 and 314:
B10406SCHULMANN ET AL.: RHEOLOGY OF
- Page 315 and 316:
B10406SCHULMANN ET AL.: RHEOLOGY OF
- Page 317 and 318:
B10406SCHULMANN ET AL.: RHEOLOGY OF
- Page 319 and 320:
B10406SCHULMANN ET AL.: RHEOLOGY OF
- Page 321 and 322:
B10406SCHULMANN ET AL.: RHEOLOGY OF
- Page 323 and 324:
B10406SCHULMANN ET AL.: RHEOLOGY OF
- Page 325 and 326:
B10406SCHULMANN ET AL.: RHEOLOGY OF
- Page 327 and 328:
J. metamorphic Geol., 2008, 26, 29-
- Page 329 and 330:
ORIGIN OF FELSIC MIGMATITES 31Ó 20
- Page 331 and 332:
ORIGIN OF FELSIC MIGMATITES 33durin
- Page 333 and 334:
ORIGIN OF FELSIC MIGMATITES 35(a)Ty
- Page 335 and 336:
ORIGIN OF FELSIC MIGMATITES 37(a)Pl
- Page 337 and 338:
ORIGIN OF FELSIC MIGMATITES 39Grain
- Page 339 and 340:
ORIGIN OF FELSIC MIGMATITES 41(a)(b
- Page 341 and 342:
ORIGIN OF FELSIC MIGMATITES 43(a)(b
- Page 343 and 344:
ORIGIN OF FELSIC MIGMATITES 45Fig.
- Page 345 and 346:
ORIGIN OF FELSIC MIGMATITES 47produ
- Page 347 and 348:
ORIGIN OF FELSIC MIGMATITES 49stron
- Page 349 and 350:
ORIGIN OF FELSIC MIGMATITES 51Cmı
- Page 351:
ORIGIN OF FELSIC MIGMATITES 53easte
- Page 354 and 355:
104 J. FRANĚK ET AL.in terms of th
- Page 356 and 357:
106 J. FRANĚK ET AL.Fig. 2. Struct
- Page 358 and 359:
108 J. FRANĚK ET AL.(a)perthite po
- Page 360 and 361:
110 J. FRANĚK ET AL.(a)(b)(c) (d)
- Page 362 and 363:
112 J. FRANĚK ET AL.Table 1. Repre
- Page 364 and 365:
114 J. FRANĚK ET AL.at these P-T c
- Page 366 and 367:
116 J. FRANĚK ET AL.(a)(b)Fig. 10.
- Page 368 and 369:
118 J. FRANĚK ET AL.(a)(b)Fig. 11.
- Page 370 and 371:
120 J. FRANĚK ET AL.Table 2. Quant
- Page 372 and 373:
122 J. FRANĚK ET AL.(a)(b)Fig. 15.
- Page 374 and 375:
124 J. FRANĚK ET AL.Fig. 16. Inter
- Page 376 and 377:
126 J. FRANĚK ET AL.development of
- Page 378 and 379:
128 J. FRANĚK ET AL.Behrmann, J.H.
- Page 380:
130 J. FRANĚK ET AL.Southern Bohem