Hydro Annual Report 2011b
Hydro Annual Report 2011b
Hydro Annual Report 2011b

You also want an ePaper? Increase the reach of your titles
YUMPU automatically turns print PDFs into web optimized ePapers that Google loves.
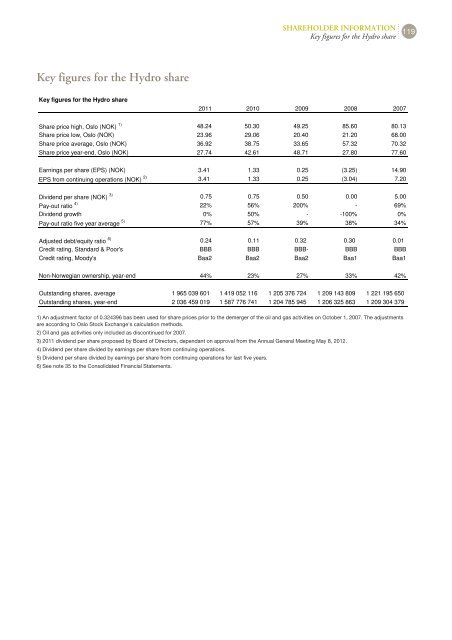
Key figures for the <strong>Hydro</strong> share<br />
Key figures for the <strong>Hydro</strong> share<br />
2011 2010 2009 2008 2007<br />
Share price high, Oslo (NOK) 1) 48.24 50.30 49.25 85.60 80.13<br />
Share price low, Oslo (NOK) 23.96 29.06 20.40 21.20 68.00<br />
Share price average, Oslo (NOK) 36.92 38.75 33.65 57.32 70.32<br />
Share price year-end, Oslo (NOK) 27.74 42.61 48.71 27.80 77.60<br />
Earnings per share (EPS) (NOK) 3.41 1.33 0.25 (3.25) 14.90<br />
EPS from continuing operations (NOK) 2) 3.41 1.33 0.25 (3.04) 7.20<br />
Dividend per share (NOK) 3) 0.75 0.75 0.50 0.00 5.00<br />
Pay-out ratio 4) 22% 56% 200% - 69%<br />
Dividend growth 0% 50% - -100% 0%<br />
Pay-out ratio five year average 5) 77% 57% 39% 38% 34%<br />
Adjusted debt/equity ratio 6) 0.24 0.11 0.32 0.30 0.01<br />
Credit rating, Standard & Poor's BBB BBB BBB- BBB BBB<br />
Credit rating, Moody's Baa2 Baa2 Baa2 Baa1 Baa1<br />
Non-Norwegian ownership, year-end 44% 23% 27% 33% 42%<br />
Outstanding shares, average 1 965 039 601<br />
Outstanding shares, year-end 2 036 459 019<br />
1 419 052 116<br />
1 587 776 741<br />
1 205 376 724<br />
1 204 785 945<br />
1 209 143 809<br />
1 206 325 863<br />
1 221 195 650<br />
1 209 304 379<br />
1) An adjustment factor of 0.324396 bas been used for share prices prior to the demerger of the oil and gas activities on October 1, 2007. The adjustments<br />
are according to Oslo Stock Exchange's calculation methods.<br />
2) Oil and gas activities only included as discontinued for 2007.<br />
3) 2011 dividend per share proposed by Board of Directors, dependant on approval from the <strong>Annual</strong> General Meeting May 8, 2012.<br />
4) Dividend per share divided by earnings per share from continuing operations.<br />
5) Dividend per share divided by earnings per share from continuing operations for last five years.<br />
6) See note 35 to the Consolidated Financial Statements.<br />
SHAREHOLDER INFORMATION<br />
Key figures for the <strong>Hydro</strong> share 119