Hydro Annual Report 2011b
Hydro Annual Report 2011b
Hydro Annual Report 2011b

Create successful ePaper yourself
Turn your PDF publications into a flip-book with our unique Google optimized e-Paper software.
78<br />
VIABILITY PERFORMANCE<br />
Facts and figures<br />
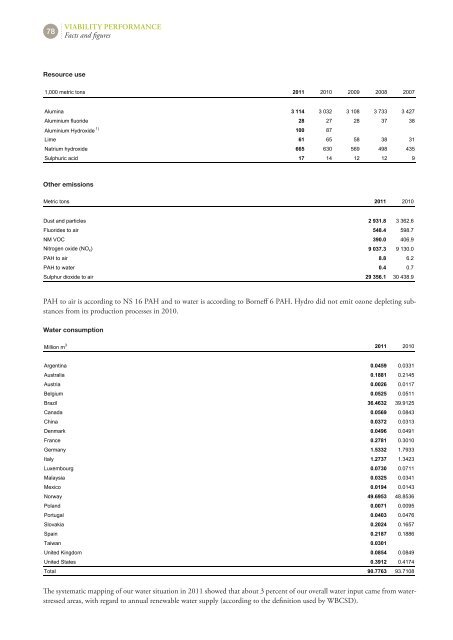
Resource use<br />
Resource use<br />
1,000 metric tons 2011 2010 2009 2008 2007<br />
Alumina 3 114 3 032 3 108 3 733 3 427<br />
Aluminium fluoride 28 27 28 37 38<br />
Aluminium <strong>Hydro</strong>xide 1)<br />
100 87<br />
Lime 61 65 58 38 31<br />
Natrium hydroxide 665 630 569 498 435<br />
Sulphuric acid 17 14 12 12 9<br />
Other emissions<br />
Metric tons 2011 2010<br />
Dust and particles 2 931.8 3 362.6<br />
Fluorides to air 548.4 598.7<br />
NM VOC 390.0 406.9<br />
Nitrogen oxide (NOx) 9 037.3 9 130.0<br />
PAH to air 8.8 6.2<br />
PAH to water 0.4 0.7<br />
Sulphur dioxide to air 29 356.1 30 438.9<br />
PAH to air is according to NS 16 PAH and to water is according to Borneff 6 PAH. <strong>Hydro</strong> did not emit ozone depleting substances<br />
from its production processes in 2010.<br />
Water consumption<br />
Million m 3 2011 2010<br />
Argentina 0.0459 0.0331<br />
Australia 0.1881 0.2145<br />
Austria 0.0026 0.0117<br />
Belgium 0.0525 0.0511<br />
Brazil 36.4632 39.9125<br />
Canada 0.0569 0.0843<br />
China 0.0372 0.0313<br />
Denmark 0.0496 0.0491<br />
France 0.2781 0.3010<br />
Germany 1.5332 1.7933<br />
Italy 1.2737 1.3423<br />
Luxembourg 0.0730 0.0711<br />
Malaysia 0.0325 0.0341<br />
Mexico 0.0194 0.0143<br />
Norway 49.6953 48.8536<br />
Poland 0.0071 0.0095<br />
Portugal 0.0403 0.0476<br />
Slovakia 0.2024 0.1657<br />
Spain 0.2187 0.1886<br />
Taiwan 0.0301<br />
United Kingdom 0.0854 0.0849<br />
United States 0.3912 0.4174<br />
Total 90.7763 93.7108<br />
The systematic mapping of our water situation in 2011 showed that about 3 percent of our overall water input came from waterstressed<br />
areas, with regard to annual renewable water supply (according to the definition used by WBCSD).