Hydro Annual Report 2011b
Hydro Annual Report 2011b
Hydro Annual Report 2011b

Create successful ePaper yourself
Turn your PDF publications into a flip-book with our unique Google optimized e-Paper software.
F26<br />
FINANCIAL STATEMENTS<br />
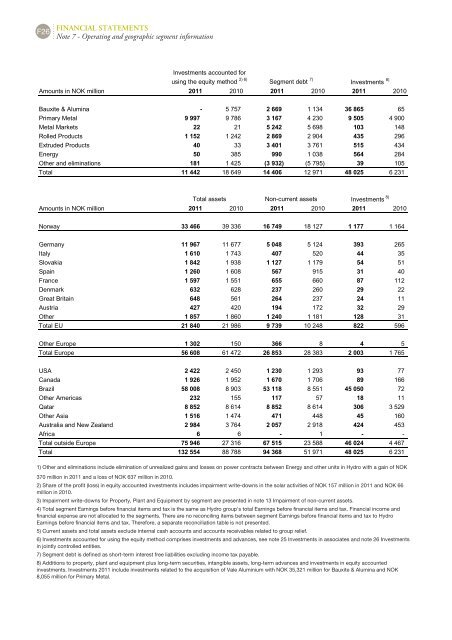
Note 7 - Operating and geographic segment information<br />
Investments accounted for<br />
using the equity method<br />
2) 6)<br />
Segment debt 7)<br />
Amounts in NOK million 2011 2010 2011 2010 2011 2010<br />
Bauxite & Alumina 5 757 2 669 1 134 36 865 65<br />
Primary Metal 9 997 9 786 3 167 4 230 9 505 4 900<br />
Metal Markets 22 21 5 242 5 698 103 148<br />
Rolled Products 1 152 1 242 2 869 2 904 435 296<br />
Extruded Products 40 33 3 401 3 761 515 434<br />
Energy 50 385 990 1 038 564 284<br />
Other and eliminations 181 1 425 (3 932) (5 795) 39 105<br />
Total 11 442 18 649 14 406 12 971 48 025 6 231<br />
Total assets Noncurrent assets<br />
Investments 8)<br />
Investments 8)<br />
Amounts in NOK million 2011 2010 2011 2010 2011 2010<br />
Norway 33 466 39 336 16 749 18 127 1 177 1 164<br />
Germany 11 967 11 677 5 048 5 124 393 265<br />
Italy 1 610 1 743 407 520 44 35<br />
Slovakia 1 842 1 938 1 127 1 179 54 51<br />
Spain 1 260 1 608 567 915 31 40<br />
France 1 597 1 551 655 660 87 112<br />
Denmark 632 628 237 260 29 22<br />
Great Britain 648 561 264 237 24 11<br />
Austria 427 420 194 172 32 29<br />
Other 1 857 1 860 1 240 1 181 128 31<br />
Total EU 21 840 21 986 9 739 10 248 822 596<br />
Other Europe 1 302 150 366 8 4 5<br />
Total Europe 56 608 61 472 26 853 28 383 2 003 1 765<br />
USA 2 422 2 450 1 230 1 293 93 77<br />
Canada 1 926 1 952 1 670 1 706 89 166<br />
Brazil 58 008 8 903 53 118 8 551 45 050 72<br />
Other Americas 232 155 117 57 18 11<br />
Qatar 8 852 8 614 8 852 8 614 306 3 529<br />
Other Asia 1 516 1 474 471 448 45 160<br />
Australia and New Zealand 2 984 3 764 2 057 2 918 424 453<br />
Africa 6 6 1 <br />
Total outside Europe 75 946 27 316 67 515 23 588 46 024 4 467<br />
Total 132 554 88 788 94 368 51 971 48 025 6 231<br />
1) Other and eliminations include elimination of unrealized gains and losses on power contracts between Energy and other units in <strong>Hydro</strong> with a gain of NOK<br />
370 million in 2011 and a loss of NOK 637 million in 2010.<br />
2) Share of the profit (loss) in equity accounted investments includes impairment write-downs in the solar activities of NOK 157 million in 2011 and NOK 66<br />
million in 2010.<br />
3) Impairment write-downs for Property, Plant and Equipment by segment are presented in note 13 Impairment of non-current assets.<br />
4) Total segment Earnings before financial items and tax is the same as <strong>Hydro</strong> group's total Earnings before financial items and tax. Financial income and<br />
financial expense are not allocated to the segments. There are no reconciling items between segment Earnings before financial items and tax to <strong>Hydro</strong><br />
Earnings before financial items and tax. Therefore, a separate reconciliation table is not presented.<br />
5) Current assets and total assets exclude internal cash accounts and accounts receivables related to group relief.<br />
6) Investments accounted for using the equity method comprises investments and advances, see note 25 Investments in associates and note 26 Investments<br />
in jointly controlled entities.<br />
7) Segment debt is defined as short-term interest free liabilities excluding income tax payable.<br />
8) Additions to property, plant and equipment plus long-term securities, intangible assets, long-term advances and investments in equity accounted<br />
investments. Investments 2011 include investments related to the acquisition of Vale Aluminium with NOK 35,321 million for Bauxite & Alumina and NOK<br />
8,055 million for Primary Metal.