Hydro Annual Report 2011b
Hydro Annual Report 2011b
Hydro Annual Report 2011b

Create successful ePaper yourself
Turn your PDF publications into a flip-book with our unique Google optimized e-Paper software.
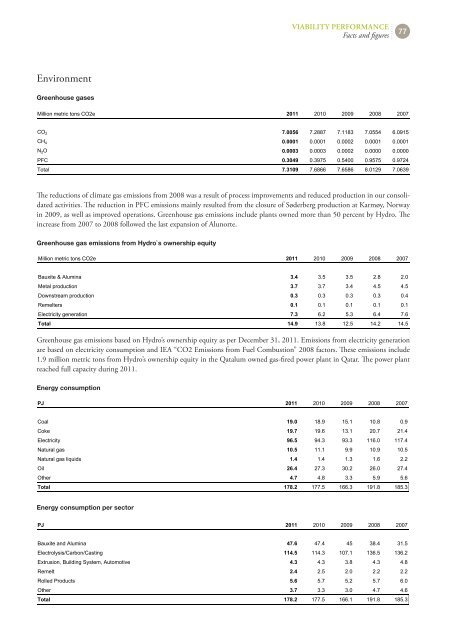
Environment<br />
Greenhouse gases gases<br />
VIABILITY PERFORMANCE<br />
Facts and figures<br />
Million metric tons CO2e 2011 2010 2009 2008 2007<br />
CO 2 7.0056 7.2887 7.1183 7.0554 6.0915<br />
CH 4 0.0001 0.0001 0.0002 0.0001 0.0001<br />
N 2O 0.0003 0.0003 0.0002 0.0000 0.0000<br />
PFC 0.3049 0.3975 0.5400 0.9575 0.9724<br />
Total 7.3109 7.6866 7.6586 8.0129 7.0639<br />
The reductions of climate gas emissions from 2008 was a result of process improvements and reduced production in our consolidated<br />
activities. The reduction in PFC emissions mainly resulted from the closure of Søderberg production at Karmøy, Norway<br />
in 2009, as well as improved operations. Greenhouse gas emissions include plants owned more than 50 percent by <strong>Hydro</strong>. The<br />
increase from 2007 to 2008 followed the last expansion of Alunorte.<br />
Greenhouse gas gas emissions emissions from from <strong>Hydro</strong>`s <strong>Hydro</strong>`s ownership ownership equity equity<br />
Million metric tons CO2e 2011 2010 2009 2008 2007<br />
Bauxite & Alumina 3.4 3.5 3.5 2.8 2.0<br />
Metal production 3.7 3.7 3.4 4.5 4.5<br />
Downstream production 0.3 0.3 0.3 0.3 0.4<br />
Remelters 0.1 0.1 0.1 0.1 0.1<br />
Electricity generation 7.3 6.2 5.3 6.4 7.6<br />
Total 14.9 13.8 12.5 14.2 14.5<br />
Greenhouse gas emissions based on <strong>Hydro</strong>’s ownership equity as per December 31, 2011. Emissions from electricity generation<br />
are based on electricity consumption and IEA “CO2 Emissions from Fuel Combustion” 2008 factors. These emissions include<br />
1.9 million metric tons from <strong>Hydro</strong>’s ownership equity in the Qatalum owned gas-fired power plant in Qatar. The power plant<br />
reached full capacity during 2011.<br />
Energy consumption (PJ, Ownership >50%)<br />
PJ 2011 2010 2009 2008 2007<br />
Coal 19.0 18.9 15.1 10.8 0.9<br />
Coke 19.7 19.6 13.1 20.7 21.4<br />
Electricity 96.5 94.3 93.3 116.0 117.4<br />
Natural gas 10.5 11.1 9.9 10.9 10.5<br />
Natural gas liquids 1.4 1.4 1.3 1.6 2.2<br />
Oil 26.4 27.3 30.2 26.0 27.4<br />
Other 4.7 4.8 3.3 5.9 5.6<br />
Total 178.2 177.5 166.3 191.8 185.3<br />
Energy consumption per sector per sector (PJ, Ownership >50%)<br />
PJ 2011 2010 2009 2008 2007<br />
Bauxite and Alumina 47.6 47.4 45 38.4 31.5<br />
Electrolysis/Carbon/Casting 114.5 114.3 107.1 136.5 136.2<br />
Extrusion, Building System, Automotive 4.3 4.3 3.8 4.3 4.8<br />
Remelt 2.4 2.5 2.0 2.2 2.2<br />
Rolled Products 5.6 5.7 5.2 5.7 6.0<br />
Other 3.7 3.3 3.0 4.7 4.6<br />
Total 178.2 177.5 166.1 191.8 185.3<br />
77