Hydro Annual Report 2011b
Hydro Annual Report 2011b
Hydro Annual Report 2011b

Create successful ePaper yourself
Turn your PDF publications into a flip-book with our unique Google optimized e-Paper software.
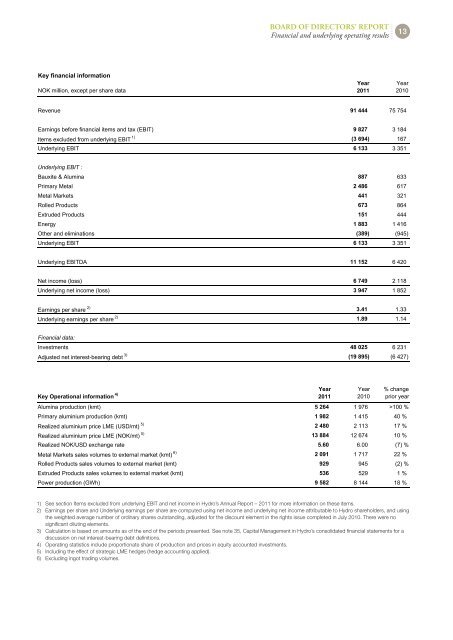
Key financial information<br />
NOK million, except per share data<br />
BoArD oF DIreCtors’ report<br />
Financial and underlying operating results<br />
Revenue 91 444 75 754<br />
Earnings before financial items and tax (EBIT) 9 827 3 184<br />
Items excluded from underlying EBIT 1) (3 694) 167<br />
Underlying EBIT 6 133 3 351<br />
Underlying EBIT :<br />
Bauxite & Alumina 887 633<br />
Primary Metal 2 486 617<br />
Metal Markets 441 321<br />
Rolled Products 673 864<br />
Extruded Products 151 444<br />
Energy 1 883 1 416<br />
Other and eliminations (389) (945)<br />
Underlying EBIT 6 133 3 351<br />
Underlying EBITDA 11 152 6 420<br />
Net income (loss) 6 749 2 118<br />
Underlying net income (loss) 3 947 1 852<br />
Earnings per share 2) 3.41 1.33<br />
Underlying earnings per share 2) 1.89 1.14<br />
Financial data:<br />
Investments 48 025 6 231<br />
Adjusted net interest-bearing debt 3) (19 895) (6 427)<br />
Key Operational information 4)<br />
1) See section Items excluded from underlying EBIT and net income in <strong>Hydro</strong>’s <strong>Annual</strong> <strong>Report</strong> – 2011 for more information on these items.<br />
2) Earnings per share and Underlying earnings per share are computed using net income and underlying net income attributable to <strong>Hydro</strong> shareholders, and using<br />
the weighted average number of ordinary shares outstanding, adjusted for the discount element in the rights issue completed in July 2010. There were no<br />
significant diluting elements.<br />
3) Calculation is based on amounts as of the end of the periods presented. See note 35, Capital Management in <strong>Hydro</strong>’s consolidated financial statements for a<br />
discussion on net interest-bearing debt definitions.<br />
4) Operating statistics include proportionate share of production and prices in equity accounted investments.<br />
5) Including the effect of strategic LME hedges (hedge accounting applied).<br />
6) Excluding ingot trading volumes.<br />
Year<br />
2011<br />
Year<br />
2011<br />
Year<br />
2010<br />
13<br />
Year<br />
2010<br />
% change<br />
prior year<br />
Alumina production (kmt) 5 264 1 976 >100 %<br />
Primary aluminium production (kmt) 1 982 1 415 40 %<br />
Realized aluminium price LME (USD/mt) 5) 2 480 2 113 17 %<br />
Realized aluminium price LME (NOK/mt) 5) 13 884 12 674 10 %<br />
Realized NOK/USD exchange rate 5.60 6.00 (7) %<br />
Metal Markets sales volumes to external market (kmt) 6) 2 091 1 717 22 %<br />
Rolled Products sales volumes to external market (kmt) 929 945 (2) %<br />
Extruded Products sales volumes to external market (kmt) 536 529 1 %<br />
Power production (GWh) 9 582 8 144 18 %