Hydro Annual Report 2011b
Hydro Annual Report 2011b
Hydro Annual Report 2011b

Create successful ePaper yourself
Turn your PDF publications into a flip-book with our unique Google optimized e-Paper software.
82<br />
FINANCIAL AND OPERATING PERFORMANCE<br />
Financial and operating review<br />
Financial and operating review<br />
Summary of financial and operating results<br />
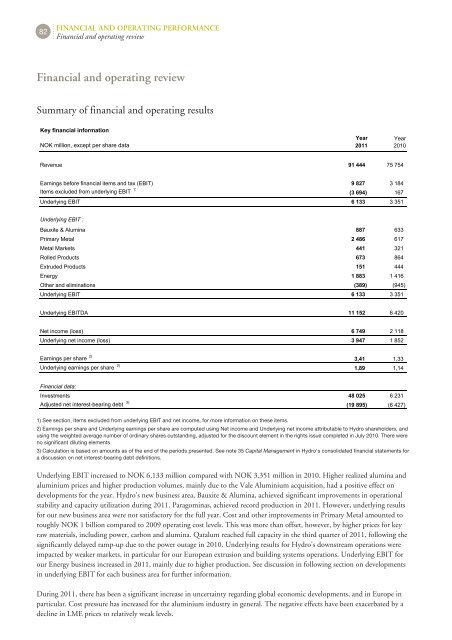
Key financial information<br />
NOK million, except per share data<br />
Revenue 91 444 75 754<br />
Earnings before financial items and tax (EBIT) 9 827 3 184<br />
Items excluded from underlying EBIT 1)<br />
(3 694) 167<br />
Underlying EBIT 6 133 3 351<br />
Underlying EBIT :<br />
Bauxite & Alumina 887 633<br />
Primary Metal 2 486 617<br />
Metal Markets 441 321<br />
Rolled Products 673 864<br />
Extruded Products 151 444<br />
Energy 1 883 1 416<br />
Other and eliminations (389) (945)<br />
Underlying EBIT 6 133 3 351<br />
Underlying EBITDA 11 152 6 420<br />
Net income (loss) 6 749 2 118<br />
Underlying net income (loss) 3 947 1 852<br />
Earnings per share 2)<br />
Underlying earnings per share 2)<br />
Financial data:<br />
Year<br />
2011<br />
Year<br />
2010<br />
3,41 1,33<br />
1,89 1,14<br />
Investments 48 025 6 231<br />
Adjusted net interest-bearing debt 3)<br />
1) See section, Items excluded from underlying EBIT and net income, for more information on these items.<br />
(19 895) (6 427)<br />
2) Earnings per share and Underlying earnings per share are computed using Net income and Underlying net income attributable to <strong>Hydro</strong> shareholders, and<br />
using the weighted average number of ordinary shares outstanding, adjusted for the discount element in the rights issue completed in July 2010. There were<br />
no significant diluting elements.<br />
3) Calculation is based on amounts as of the end of the periods presented. See note 35 Capital Management in <strong>Hydro</strong>'s consolidated financial statements for<br />
a discussion on net interest-bearing debt definitions.<br />
Underlying EBIT increased to NOK 6,133 million compared with NOK 3,351 million in 2010. Higher realized alumina and<br />
aluminium prices and higher production volumes, mainly due to the Vale Aluminium acquisition, had a positive effect on<br />
developments for the year. <strong>Hydro</strong>'s new business area, Bauxite & Alumina, achieved significant improvements in operational<br />
stability and capacity utilization during 2011. Paragominas, achieved record production in 2011. However, underlying results<br />
for our new business area were not satisfactory for the full year. Cost and other improvements in Primary Metal amounted to<br />
roughly NOK 1 billion compared to 2009 operating cost levels. This was more than offset, however, by higher prices for key<br />
raw materials, including power, carbon and alumina. Qatalum reached full capacity in the third quarter of 2011, following the<br />
significantly delayed ramp-up due to the power outage in 2010. Underlying results for <strong>Hydro</strong>'s downstream operations were<br />
impacted by weaker markets, in particular for our European extrusion and building systems operations. Underlying EBIT for<br />
our Energy business increased in 2011, mainly due to higher production. See discussion in following section on developments<br />
in underlying EBIT for each business area for further information.<br />
During 2011, there has been a significant increase in uncertainty regarding global economic developments, and in Europe in<br />
particular. Cost pressure has increased for the aluminium industry in general. The negative effects have been exacerbated by a<br />
decline in LME prices to relatively weak levels.