Hydro Annual Report 2011b
Hydro Annual Report 2011b
Hydro Annual Report 2011b

Create successful ePaper yourself
Turn your PDF publications into a flip-book with our unique Google optimized e-Paper software.
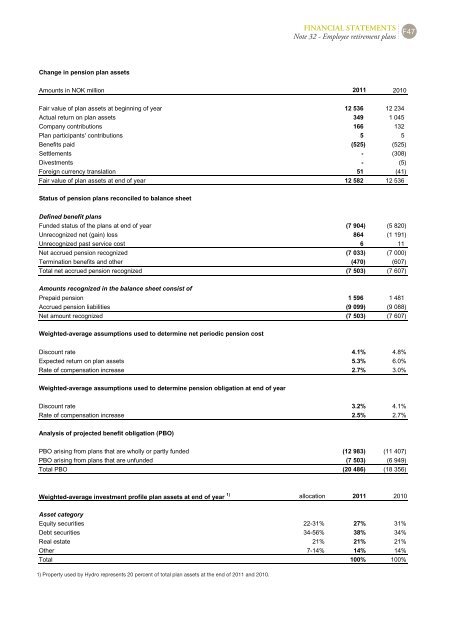
Change in pension plan assets<br />
Amounts in NOK million 2011 2010<br />
Fair value of plan assets at beginning of year 12 536 12 234<br />
Actual return on plan assets 349 1 045<br />
Company contributions 166 132<br />
Plan participants' contributions 5 5<br />
Benefits paid (525) (525)<br />
Settlements (308)<br />
Divestments (5)<br />
Foreign currency translation 51 (41)<br />
Fair value of plan assets at end of year 12 582 12 536<br />
Status of pension plans reconciled to balance sheet<br />
Defined benefit plans<br />
Funded status of the plans at end of year (7 904) (5 820)<br />
Unrecognized net (gain) loss 864 (1 191)<br />
Unrecognized past service cost 6 11<br />
Net accrued pension recognized (7 033) (7 000)<br />
Termination benefits and other (470) (607)<br />
Total net accrued pension recognized (7 503) (7 607)<br />
Amounts recognized in the balance sheet consist of<br />
Prepaid pension 1 596 1 481<br />
Accrued pension liabilities (9 099) (9 088)<br />
Net amount recognized (7 503) (7 607)<br />
Weightedaverage assumptions used to determine net periodic pension cost<br />
Discount rate 4.1% 4.8%<br />
Expected return on plan assets 5.3% 6.0%<br />
Rate of compensation increase 2.7% 3.0%<br />
Weightedaverage assumptions used to determine pension obligation at end of year<br />
Discount rate 3.2% 4.1%<br />
Rate of compensation increase 2.5% 2.7%<br />
Analysis of projected benefit obligation (PBO)<br />
PBO arising from plans that are wholly or partly funded (12 983) (11 407)<br />
PBO arising from plans that are unfunded (7 503) (6 949)<br />
Total PBO (20 486) (18 356)<br />
Weightedaverage investment profile plan assets at end of year 1) allocation 2011 2010<br />
Asset category<br />
Equity securities 2231% 27% 31%<br />
Debt securities 3456% 38% 34%<br />
Real estate 21% 21% 21%<br />
Other 714% 14% 14%<br />
Total 100% 100%<br />
1) Property used by <strong>Hydro</strong> represents 20 percent of total plan assets at the end of 2011 and 2010.<br />
FINANCIAL STATEMENTS<br />
Note 32 - Employee retirement plans F47