Hydro Annual Report 2011b
Hydro Annual Report 2011b
Hydro Annual Report 2011b

You also want an ePaper? Increase the reach of your titles
YUMPU automatically turns print PDFs into web optimized ePapers that Google loves.
90<br />
FINANCIAL AND OPERATING PERFORMANCE<br />
Metal Markets<br />
7) from April 2010<br />
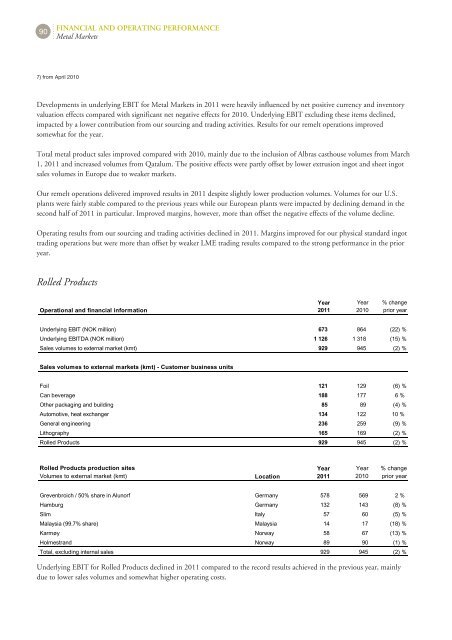
Developments in underlying EBIT for Metal Markets in 2011 were heavily influenced by net positive currency and inventory<br />
valuation effects compared with significant net negative effects for 2010. Underlying EBIT excluding these items declined,<br />
impacted by a lower contribution from our sourcing and trading activities. Results for our remelt operations improved<br />
somewhat for the year.<br />
Total metal product sales improved compared with 2010, mainly due to the inclusion of Albras casthouse volumes from March<br />
1, 2011 and increased volumes from Qatalum. The positive effects were partly offset by lower extrusion ingot and sheet ingot<br />
sales volumes in Europe due to weaker markets.<br />
Our remelt operations delivered improved results in 2011 despite slightly lower production volumes. Volumes for our U.S.<br />
plants were fairly stable compared to the previous years while our European plants were impacted by declining demand in the<br />
second half of 2011 in particular. Improved margins, however, more than offset the negative effects of the volume decline.<br />
Operating results from our sourcing and trading activities declined in 2011. Margins improved for our physical standard ingot<br />
trading operations but were more than offset by weaker LME trading results compared to the strong performance in the prior<br />
year.<br />
Rolled Products<br />
Operational and financial information<br />
Year<br />
2011<br />
Year<br />
2010<br />
% change<br />
prior year<br />
Underlying EBIT (NOK million) 673 864 (22) %<br />
Underlying EBITDA (NOK million) 1 126 1 318 (15) %<br />
Sales volumes to external market (kmt) 929 945 (2) %<br />
Sales volumes to external markets (kmt) Customer business units<br />
Foil 121 129 (6) %<br />
Can beverage 188 177 6 %<br />
Other packaging and building 85 89 (4) %<br />
Automotive, heat exchanger 134 122 10 %<br />
General engineering 236 259 (9) %<br />
Lithography 165 169 (2) %<br />
Rolled Products 929 945 (2) %<br />
Rolled Products production sites<br />
Volumes to external market (kmt) Location<br />
Year<br />
2011<br />
Year<br />
2010<br />
% change<br />
prior year<br />
Grevenbroich / 50% share in Alunorf Germany 578 569 2 %<br />
Hamburg Germany 132 143 (8) %<br />
Slim Italy 57 60 (5) %<br />
Malaysia (99.7% share) Malaysia 14 17 (18) %<br />
Karmøy Norway 58 67 (13) %<br />
Holmestrand Norway 89 90 (1) %<br />
Total, excluding internal sales 929 945 (2) %<br />
Underlying EBIT for Rolled Products declined in 2011 compared to the record results achieved in the previous year, mainly<br />
due to lower sales volumes and somewhat higher operating costs.