Hydro Annual Report 2011b
Hydro Annual Report 2011b
Hydro Annual Report 2011b

Create successful ePaper yourself
Turn your PDF publications into a flip-book with our unique Google optimized e-Paper software.
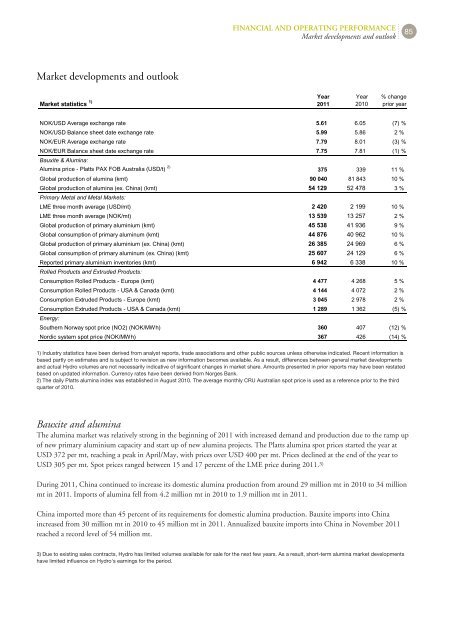
Market developments and outlook<br />
Market statistics 1)<br />
Year<br />
2011<br />
Year<br />
2010<br />
% change<br />
prior year<br />
NOK/USD Average exchange rate 5.61 6.05 (7) %<br />
NOK/USD Balance sheet date exchange rate 5.99 5.86 2 %<br />
NOK/EUR Average exchange rate 7.79 8.01 (3) %<br />
NOK/EUR Balance sheet date exchange rate 7.75 7.81 (1) %<br />
Bauxite & Alumina:<br />
Alumina price Platts PAX FOB Australia (USD/t) 2)<br />
375 339 11 %<br />
Global production of alumina (kmt) 90 040 81 843 10 %<br />
Global production of alumina (ex. China) (kmt) 54 129 52 478 3 %<br />
Primary Metal and Metal Markets:<br />
LME three month average (USD/mt) 2 420 2 199 10 %<br />
LME three month average (NOK/mt) 13 539 13 257 2 %<br />
Global production of primary aluminium (kmt) 45 538 41 936 9 %<br />
Global consumption of primary aluminum (kmt) 44 876 40 962 10 %<br />
Global production of primary aluminium (ex. China) (kmt) 26 385 24 969 6 %<br />
Global consumption of primary aluminum (ex. China) (kmt) 25 607 24 129 6 %<br />
<strong>Report</strong>ed primary aluminium inventories (kmt) 6 942 6 338 10 %<br />
Rolled Products and Extruded Products:<br />
Consumption Rolled Products Europe (kmt) 4 477 4 268 5 %<br />
Consumption Rolled Products USA & Canada (kmt) 4 144 4 072 2 %<br />
Consumption Extruded Products Europe (kmt) 3 045 2 978 2 %<br />
Consumption Extruded Products USA & Canada (kmt) 1 289 1 362 (5) %<br />
Energy:<br />
FINANCIAL AND OPERATING PERFORMANCE<br />
Market developments and outlook<br />
Southern Norway spot price (NO2) (NOK/MWh) 360 407 (12) %<br />
Nordic system spot price (NOK/MWh) 367 426 (14) %<br />
1) Industry statistics have been derived from analyst reports, trade associations and other public sources unless otherwise indicated. Recent information is<br />
based partly on estimates and is subject to revision as new information becomes available. As a result, differences between general market developments<br />
and actual <strong>Hydro</strong> volumes are not necessarily indicative of significant changes in market share. Amounts presented in prior reports may have been restated<br />
based on updated information. Currency rates have been derived from Norges Bank.<br />
2) The daily Platts alumina index was established in August 2010. The average monthly CRU Australian spot price is used as a reference prior to the third<br />
quarter of 2010.<br />
Bauxite and alumina<br />
The alumina market was relatively strong in the beginning of 2011 with increased demand and production due to the ramp up<br />
of new primary aluminium capacity and start up of new alumina projects. The Platts alumina spot prices started the year at<br />
USD 372 per mt, reaching a peak in April/May, with prices over USD 400 per mt. Prices declined at the end of the year to<br />
USD 305 per mt. Spot prices ranged between 15 and 17 percent of the LME price during 2011. 3)<br />
During 2011, China continued to increase its domestic alumina production from around 29 million mt in 2010 to 34 million<br />
mt in 2011. Imports of alumina fell from 4.2 million mt in 2010 to 1.9 million mt in 2011.<br />
China imported more than 45 percent of its requirements for domestic alumina production. Bauxite imports into China<br />
increased from 30 million mt in 2010 to 45 million mt in 2011. <strong>Annual</strong>ized bauxite imports into China in November 2011<br />
reached a record level of 54 million mt.<br />
3) Due to existing sales contracts, <strong>Hydro</strong> has limited volumes available for sale for the next few years. As a result, short-term alumina market developments<br />
have limited influence on <strong>Hydro</strong>'s earnings for the period.<br />
85