Hydro Annual Report 2011b
Hydro Annual Report 2011b
Hydro Annual Report 2011b

You also want an ePaper? Increase the reach of your titles
YUMPU automatically turns print PDFs into web optimized ePapers that Google loves.
88<br />
FINANCIAL AND OPERATING PERFORMANCE<br />
Primary Metal<br />
Primary Metal<br />
Operational and financial information 1)<br />
Year<br />
2011<br />
Year<br />
2010<br />
% change<br />
prior year<br />
Underlying EBIT (NOK million) 2 486 617 >100 %<br />
Underlying EBITDA (NOK million) 4 671 2 374 97 %<br />
Realized aluminium price LME (USD/mt) 2)<br />
2 480 2 113 17 %<br />
Realized aluminium price LME (NOK/mt) 2)<br />
13 884 12 674 10 %<br />
Realized premium above LME (USD/mt) 3)<br />
333 317 5 %<br />
Realized premium above LME (NOK/mt) 3)<br />
1 866 1 906 (2) %<br />
Realized NOK/USD exchange rate 5.60 6.00 (7) %<br />
Primary aluminium production (kmt) 1 982 1 415 40 %<br />
Casthouse production (kmt) 2 463 2 022 22 %<br />
Casthouse sales (kmt) 2 451 2 008 22 %<br />
1) Operating and financial information includes <strong>Hydro</strong>'s proportionate share of underlying profit (loss), production, prices, premiums and exchange rates in<br />
equity accounted investments.<br />
2) Including effect of strategic LME hedges (hedge accounting applied).<br />
3) Average realized premium above LME for total metal products sold from Primary Metal.<br />
Underlying results in equity accounted investments 4)<br />
NOK million<br />
Year<br />
2011<br />
Year<br />
2010<br />
% change<br />
prior year<br />
Søral (49.90%) 23 7 >100 %<br />
Qatalum (50.00%) 18 (648) >100 %<br />
4) Underlying results are defined as share of net income adjusted for items excluded.<br />
Primary aluminium and casthouse production (kmt) 5)<br />
Primary aluminium Casthouse production<br />
Location 2011 2010 2011 2010<br />
Albras Brazil 381 379 <br />
Karmøy Norway 184 182 218 239<br />
Årdal Norway 205 201 309 309<br />
Sunndal Norway 300 291 420 441<br />
Høyanger Norway 62 61 117 115<br />
Søral (<strong>Hydro</strong>'s 49.9% share) Norway 45 44 59 65<br />
Slovalco Slovakia 163 163 184 188<br />
Neuss Germany 53 52 174 217<br />
Kurri Kurri Australia 180 179 184 182<br />
Tomago (12.4% share) Australia 67 65 66 65<br />
Qatalum (50% share) Qatar 225 63 234 86<br />
Alouette (20% share) Canada 116 114 116 114<br />
Total production Primary Aluminium 1 982 1 415 2 463 2 022<br />
5) Production volumes for part owned companies represent our proportion of total production. For financial reporting purposes, Søral and Qatalum are<br />
accounted for as equity accounted investments, while Tomago and Alouette are consolidated on a proportional basis. Slovalco and Albras are fully<br />
consolidated in terms of financial results and volumes.<br />
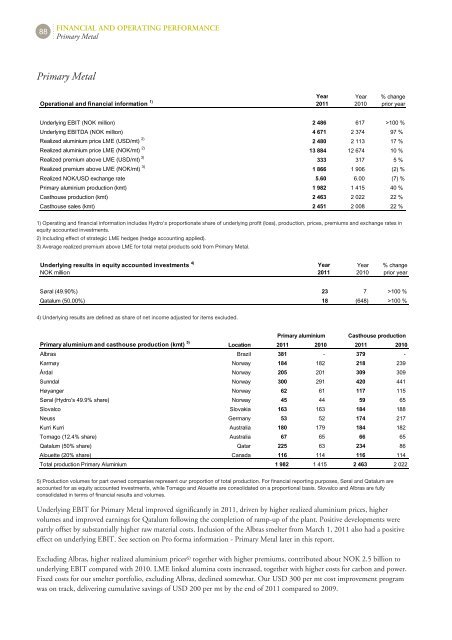
Underlying EBIT for Primary Metal improved significantly in 2011, driven by higher realized aluminium prices, higher<br />
volumes and improved earnings for Qatalum following the completion of ramp-up of the plant. Positive developments were<br />
partly offset by substantially higher raw material costs. Inclusion of the Albras smelter from March 1, 2011 also had a positive<br />
effect on underlying EBIT. See section on Pro forma information - Primary Metal later in this report.<br />
Excluding Albras, higher realized aluminium prices 6) together with higher premiums, contributed about NOK 2.5 billion to<br />
underlying EBIT compared with 2010. LME linked alumina costs increased, together with higher costs for carbon and power.<br />
Fixed costs for our smelter portfolio, excluding Albras, declined somewhat. Our USD 300 per mt cost improvement program<br />
was on track, delivering cumulative savings of USD 200 per mt by the end of 2011 compared to 2009.