April - June 2007 - Kasetsart University
April - June 2007 - Kasetsart University
April - June 2007 - Kasetsart University

Create successful ePaper yourself
Turn your PDF publications into a flip-book with our unique Google optimized e-Paper software.
enzyme and cells were maximized by using the<br />
initial pH of 6.0. The maximal specific growth rate<br />
obtained was 0.260 h -1 at the initial pH 6.0 (Table<br />
1). Higher or lower initial pH’s gave less favorable<br />
specific growth rates. At this optimal initial pH<br />
6.0, the specific rates of chitosan consumption and<br />
chitosanases production were 0.091 g/g h and<br />
31.99 U/g h, respectively. As a result, the yield<br />
and volumetric productivity of chitosanases were<br />
247.59 U/g and 35.29 U/l h, respectively (Table<br />
1). The optimal pH obtained in this work was quite<br />
similar to the results reported by Yoshihara et al.<br />
(1990) culturing Pseudomonas sp. at pH 6.3 and<br />
Tominaka and Tsujisaka (1975) producing Bacillus<br />
R-4 chitosanases at pH 6.0. Moreover, at higher<br />
pH 6.5 chitosan was difficult to dissolve and could<br />
not provide a useful carbon source for the bacterial<br />
growth. Especially, at initial pH 7.0 and 8.0,<br />
chitosan appeared in large particle sizes, which<br />
was barely consumed by the bacterial cells. The<br />
solubility of commercial chitosan being most<br />
excellent in diluted organic acids has been also<br />
reported (Kim et al., 2001). In particular, it is clear<br />
that the specific rate of chitosan consumption was<br />
enhanced 2.3-7.0 times higher at pH 4.0 than those<br />
<strong>Kasetsart</strong> J. (Nat. Sci.) 41(2) 349<br />
at elevated pH’s. Nevertheless, the specific growth<br />
rate maximized at pH 6.0 dictated the production<br />
yields of both cells and enzymes, so that the better<br />
substrate consumption could no longer monitor the<br />
production of enzymes.<br />
Effect of chitosan<br />
With 0.1 % chitosan, the highest<br />
concentrations of cells and enzymes were 0.474<br />
g/l and 475.70 U/l at 66 and 54 h, respectively.<br />
The cell and enzyme concentrations were<br />
increased to 2.125 g/l and 2,040.64 U/l at 54 h,<br />
respectively, when using 0.5% chitosan as the main<br />
substrate. No bacterial growth was found at 1.0<br />
and 2.0% chitosan because high viscosity of the<br />
culture medium limited oxygen availability for the<br />
bacterial growth. It was also reported that high<br />
chitosan concentration can inhibit the bacterial<br />
growth (No et al., 2001). In this study, the chitosan<br />
concentration of 1.0 and 2.0% could not be used<br />
as appropriate substrate concentration for the<br />
production of chitosanases. Therefore, 0.5%<br />
chitosan was finally selected for the optimal<br />
growth and chitosanases production from Bacillus<br />
cereus TP12.24. The specific growth rate and the<br />
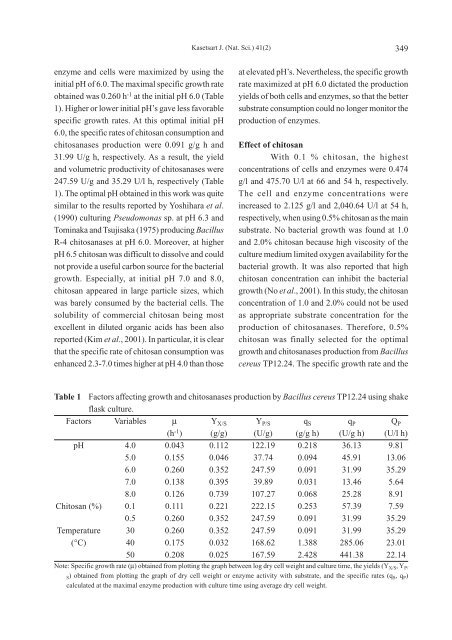
Table 1 Factors affecting growth and chitosanases production by Bacillus cereus TP12.24 using shake<br />
flask culture.<br />
Factors Variables µ Y X/S Y P/S q S q P Q P<br />
(h -1 ) (g/g) (U/g) (g/g h) (U/g h) (U/l h)<br />
pH 4.0 0.043 0.112 122.19 0.218 36.13 9.81<br />
5.0 0.155 0.046 37.74 0.094 45.91 13.06<br />
6.0 0.260 0.352 247.59 0.091 31.99 35.29<br />
7.0 0.138 0.395 39.89 0.031 13.46 5.64<br />
8.0 0.126 0.739 107.27 0.068 25.28 8.91<br />
Chitosan (%) 0.1 0.111 0.221 222.15 0.253 57.39 7.59<br />
0.5 0.260 0.352 247.59 0.091 31.99 35.29<br />
Temperature 30 0.260 0.352 247.59 0.091 31.99 35.29<br />
(°C) 40 0.175 0.032 168.62 1.388 285.06 23.01<br />
50 0.208 0.025 167.59 2.428 441.38 22.14<br />
Note: Specific growth rate (µ) obtained from plotting the graph between log dry cell weight and culture time, the yields (Y X/S, Y P/<br />
S) obtained from plotting the graph of dry cell weight or enzyme activity with substrate, and the specific rates (q S, q P)<br />
calculated at the maximal enzyme production with culture time using average dry cell weight.