April - June 2007 - Kasetsart University
April - June 2007 - Kasetsart University
April - June 2007 - Kasetsart University

Create successful ePaper yourself
Turn your PDF publications into a flip-book with our unique Google optimized e-Paper software.
370<br />
L. sakei and D. hansenii after 5 days of ripening.<br />
The decreases in glutamic acid and arginine<br />
contents might be due to these amino acids were<br />
used for the growth of the microorganisms and<br />
might be metabolized to flavours. The quantities<br />
of alanine, aspartic acid, glycine, isoleucine,<br />
leucine, methionine, phenylalanine, tyrosine,<br />
valine and lysine in the control after 5 days of<br />
ripening were higher than those before ripening.<br />
Some of these amino acids in the batches with L.<br />
sakei and the batches with L. sakei and D. hansenii<br />
also increased after ripening.<br />
Some amino acids, especially those<br />
branched-chain amino acids, have been<br />
metabolised to generate volatile compounds (Dura<br />
et al., 2004). The contents of alanine, isoleucine,<br />
histidine and proline were similar in the three<br />
<strong>Kasetsart</strong> J. (Nat. Sci.) 41(2)<br />
batches at the end of processing. Alanine,<br />
contributors of sweet taste was found in higher<br />
contents after ripening of fermented sausages.<br />
Therefore, the balance of these free amino acids<br />
would affect the sensory characteristics of the<br />
product (Ordonez et al., 1999). The addition of<br />
starter culture produced a limited effect on the free<br />
amino acid generation although the effect was<br />
different depending on the quantity of<br />
microorganisms inoculated. Many factors could<br />
affect the generation of free amino acids such as<br />
the presence of different substrates, the pH, the<br />
presence of different microorganisms and their<br />
evolution during processing. The significant (P <<br />
0.05) reduction in the concentration of free amino<br />
acids could be produced by a more intense<br />
microorganism metabolism than their production<br />
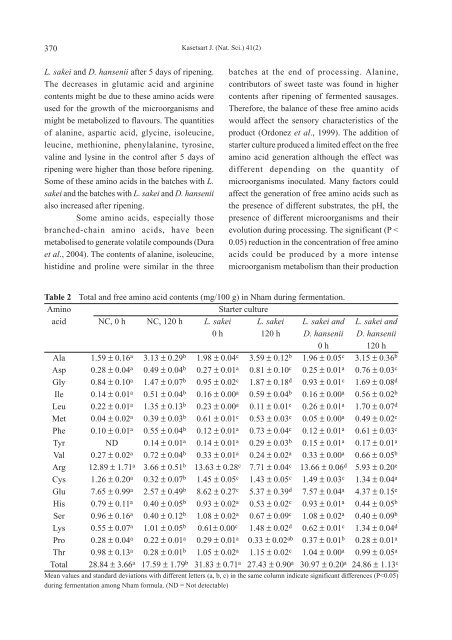
Table 2 Total and free amino acid contents (mg/100 g) in Nham during fermentation.<br />
Amino Starter culture<br />
acid NC, 0 h NC, 120 h L. sakei L. sakei L. sakei and L. sakei and<br />
0 h 120 h D. hansenii D. hansenii<br />
0 h 120 h<br />
Ala 1.59 ± 0.16a 3.13 ± 0.29b 1.98 ± 0.04c 3.59 ± 0.12b 1.96 ± 0.05c 3.15 ± 0.36b Asp 0.28 ± 0.04a 0.49 ± 0.04b 0.27 ± 0.01a 0.81 ± 0.10c 0.25 ± 0.01a 0.76 ± 0.03c Gly 0.84 ± 0.10a 1.47 ± 0.07b 0.95 ± 0.02c 1.87 ± 0.18d 0.93 ± 0.01c 1.69 ± 0.08d Ile 0.14 ± 0.01a 0.51 ± 0.04b 0.16 ± 0.00a 0.59 ± 0.04b 0.16 ± 0.00a 0.56 ± 0.02b Leu 0.22 ± 0.01a 1.35 ± 0.13b 0.23 ± 0.00a 0.11 ± 0.01c 0.26 ± 0.01a 1.70 ± 0.07d Met 0.04 ± 0.02a 0.39 ± 0.03b 0.61 ± 0.01c 0.53 ± 0.03c 0.05 ± 0.00a 0.49 ± 0.02c Phe 0.10 ± 0.01a 0.55 ± 0.04b 0.12 ± 0.01a 0.73 ± 0.04c 0.12 ± 0.01a 0.61 ± 0.03c Tyr ND 0.14 ± 0.01a 0.14 ± 0.01a 0.29 ± 0.03b 0.15 ± 0.01a 0.17 ± 0.01a Val 0.27 ± 0.02a 0.72 ± 0.04b 0.33 ± 0.01a 0.24 ± 0.02a 0.33 ± 0.00a 0.66 ± 0.05b Arg 12.89 ± 1.71a 3.66 ± 0.51b 13.63 ± 0.28c 7.71 ± 0.04c 13.66 ± 0.06d 5.93 ± 0.20e Cys 1.26 ± 0.20a 0.32 ± 0.07b 1.45 ± 0.05c 1.43 ± 0.05c 1.49 ± 0.03c 1.34 ± 0.04a Glu 7.65 ± 0.99a 2.57 ± 0.49b 8.62 ± 0.27c 5.37 ± 0.39d 7.57 ± 0.04a 4.37 ± 0.15e His 0.79 ± 0.11a 0.40 ± 0.05b 0.93 ± 0.02a 0.53 ± 0.02c 0.93 ± 0.01a 0.44 ± 0.05b Ser 0.96 ± 0.16a 0.40 ± 0.12b 1.08 ± 0.02a 0.67 ± 0.09c 1.08 ± 0.02a 0.40 ± 0.09b Lys 0.55 ± 0.07a 1.01 ± 0.05b 0.61± 0.00c 1.48 ± 0.02d 0.62 ± 0.01c 1.34 ± 0.04d Pro 0.28 ± 0.04a 0.22 ± 0.01a 0.29 ± 0.01a 0.33 ± 0.02ab 0.37 ± 0.01b 0.28 ± 0.01a Thr 0.98 ± 0.13a 0.28 ± 0.01b 1.05 ± 0.02a 1.15 ± 0.02c 1.04 ± 0.00a 0.99 ± 0.05a Total 28.84 ± 3.66a 17.59 ± 1.79b 31.83 ± 0.71a 27.43 ± 0.90a 30.97 ± 0.20a 24.86 ± 1.13c Mean values and standard deviations with different letters (a, b, c) in the same column indicate significant differences (P