- Page 2 and 3:
iDemand-Driven Technologies forSust
- Page 4 and 5:
iiiContentsPrefacePréfaceForewordA
- Page 6 and 7:
vAssessment of Striga infestation i
- Page 8 and 9:
viiPrefaceThe West and Central Afri
- Page 10 and 11:
ixendosperm maize varieties, 95 TZE
- Page 12 and 13:
Les agriculteurs de la savane guin
- Page 14 and 15:
xiiiForewordMaize (Zea mays L) is o
- Page 16 and 17:
xvAvant proposLe maïs (Zea mays L)
- Page 18 and 19:
xviiFifth Biennial West and Central
- Page 20 and 21:
xixNigeria26 Abdullahi, Y.M. NAERLS
- Page 22:
1Section1Breeding, SeedSystems and
- Page 25 and 26:
4skills of the scientists and impro
- Page 27 and 28:
6collaborating scientists. This is
- Page 29 and 30:
8fi ndings to their peers. They are
- Page 31 and 32:
10Figure 3. Funds received by indiv
- Page 33 and 34:
12Percentage PercentageYearFigure 5
- Page 35 and 36:
14Figure 9. Coefficient of variatio
- Page 37 and 38:
16Figure 15. Total maize grain prod
- Page 39 and 40:
18Table 2. Capacity Building of NAR
- Page 41 and 42:
20DiscussionResults of the analyses
- Page 43 and 44:
22the Lead Country Concept was not
- Page 45 and 46:
24Badu-Apraku, B., M.A.B. Fakorede,
- Page 47 and 48:
26et des lignées dotées de résis
- Page 49 and 50:
28Overview of the strategy for deve
- Page 51 and 52:
30Table 1. Characteristics of extra
- Page 53 and 54:
32Table 2. Performance of extra-ear
- Page 55 and 56:
34Table 3. cont’dInbredlineParent
- Page 57 and 58:
36different germplasm and for placi
- Page 59 and 60:
38Figure 1. Clustering of 35 extra-
- Page 61 and 62:
40Table 4. Number of inbred lines i
- Page 63 and 64:
42M’Boob, S.S., 1986. A regional
- Page 65 and 66: 44sur la performance de leurs hybri
- Page 67 and 68: 46Table 1. Mean grain yield (Mg ha
- Page 69 and 70: 48Table 2. Means for grain yield an
- Page 71 and 72: 50Table 4. Estimates of GCA effects
- Page 73 and 74: 52employed to exploit non-additive
- Page 75 and 76: 54deux traitements de sol (O, T). L
- Page 77 and 78: 56Table 1. Characteristic of 15 par
- Page 79 and 80: 58Table 4. Diallel analysis of vari
- Page 81 and 82: 60Table 6. Number of adapted x adap
- Page 83 and 84: 62ConclusionThe results of this stu
- Page 85 and 86: 64Combining ability of diverse maiz
- Page 87 and 88: 66S. hermonthica and S. asiatica. Y
- Page 89 and 90: 68Table 2.Mean squares of grain yie
- Page 91 and 92: 70Table 4. Mean squares of grain yi
- Page 93 and 94: 72Table 5. Estimates of general com
- Page 95 and 96: 74Table 7. Estimates of general com
- Page 97 and 98: 76yield under Striga infestation. T
- Page 99 and 100: 78Kim, S.K., V.O. Adetimirin and A.
- Page 101 and 102: 80Maize accounts for between 30 and
- Page 103 and 104: 82VII, XI and V that had grain yiel
- Page 105 and 106: 84Table 3. Inter- and intra-cluster
- Page 107 and 108: 86interest, including early, medium
- Page 109 and 110: 88IntroductionThe multi-environment
- Page 111 and 112: 90Table 1: Sums of squares (SS) exp
- Page 113 and 114: 922Table 3: Average proportion of t
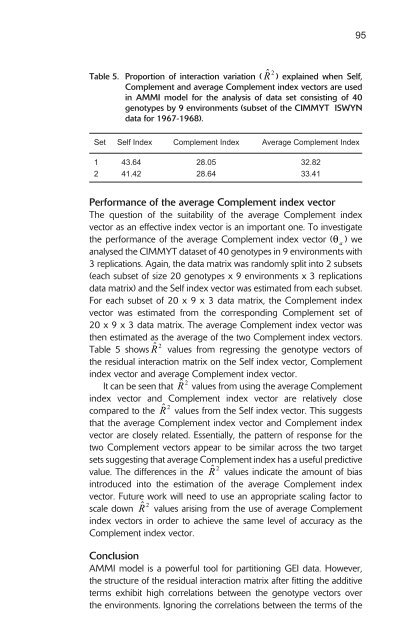
- Page 115: 94genotypes within the target sets.
- Page 119 and 120: 98Effects of farmers’ seed source
- Page 121 and 122: 100known. The objective of this stu
- Page 123 and 124: 102AFigure 1. (A) Percentage seeds
- Page 125 and 126: 104zFigure 5. Mean days to 50% silk
- Page 127 and 128: 106ReferenceAsiedu, E.A., Twumasi-A
- Page 129 and 130: 108Mexique et les USA. Dans les ann
- Page 131 and 132: 110In collaboration with the Intern
- Page 133 and 134: 112to farmers. Recommendations had
- Page 135 and 136: 114maize, the highest grain yield a
- Page 137 and 138: 116Figure 1. Trend of land area cul
- Page 139 and 140: 118ConclusionIn conclusion, the Ins
- Page 141 and 142: 120Valencia, J.A. and S.A. Breth. u
- Page 143 and 144: 122
- Page 145 and 146: 124chimique. L’effet relatif de l
- Page 147 and 148: 126Figure 1: Rainfall pattern in Sa
- Page 149 and 150: 128Percentage PercentageFigure 2: M
- Page 151 and 152: 130Table 2. Effect of organic mater
- Page 153 and 154: 132Yield increase and relative yiel
- Page 155 and 156: 134Table 5. Relative grain and stov
- Page 157 and 158: 136Dudal, R., 2002. Forty years of
- Page 159 and 160: 138Residual benefits of soybean gen
- Page 161 and 162: 140The cultivation of leguminous cr
- Page 163 and 164: 142(IITA), natural fallow and a lat
- Page 165 and 166: 144on exchangeable Ca, exchangeable
- Page 167 and 168:
146Table 4. Rotation† and fertili
- Page 169 and 170:
148Table 6. Rotation† and fertili
- Page 171 and 172:
150Table 9. Rotation† and fertili
- Page 173 and 174:
152in the top 0-15 cm layer and als
- Page 175 and 176:
154inoculation and nitrogen fertili
- Page 177 and 178:
156RésuméLes besoins du maïs en
- Page 179 and 180:
158Table 1. Monthly distribution an
- Page 181 and 182:
160was applied about 5 cm deep, mad
- Page 183 and 184:
162Table 3. Effects of legumes and
- Page 185 and 186:
164Figure 3: Grain yield of maize a
- Page 187 and 188:
166ConclusionFrom the results of th
- Page 189 and 190:
168Tarawali, G., 1991. The residual
- Page 191 and 192:
170la variété de maïs tolérant
- Page 193 and 194:
172It is necessary to validate that
- Page 195 and 196:
174Table 2. Effects of previous cro
- Page 197 and 198:
176of cowpea, than in the farmers
- Page 199 and 200:
178AcknowledgementsThe authors than
- Page 201 and 202:
180Potential of drought-tolerant ma
- Page 203 and 204:
182potential in comparison to the t
- Page 205 and 206:
184ha -1 . Fields were planted on J
- Page 207 and 208:
186Table 3. Means for days to silki
- Page 209 and 210:
188DiscussionThe observed effects o
- Page 211 and 212:
190the yield potential of the genot
- Page 213 and 214:
192Edmeades, G.O., J. Bolanos, M. H
- Page 215 and 216:
194Genotypic variation of soybean f
- Page 217 and 218:
1962002). Therefore, high BNF in so
- Page 219 and 220:
198Experimental layout, planting an
- Page 221 and 222:
200At 8 WAP, fi ve plants were rand
- Page 223 and 224:
202Figure 1. Relationships between
- Page 225 and 226:
204signifi cant correlation (P ≤
- Page 227 and 228:
206Table 4. Total N accumulation (k
- Page 229 and 230:
208Table 5. Total P in grain (kg ha
- Page 231 and 232:
210Table 6. Grain yield (kg ha -1 )
- Page 233 and 234:
212colonization in previous RP plot
- Page 235 and 236:
214(Table 8). However, within speci
- Page 237 and 238:
216maize-after-soybean plots over t
- Page 239 and 240:
218The observed trends in grain yie
- Page 241 and 242:
220in soybean than in maize grain d
- Page 243 and 244:
222IITA (International Institute of
- Page 245 and 246:
224Snedecor G.W., Cochran G. (1980)
- Page 247 and 248:
226irrigated conditions in the Sahe
- Page 249 and 250:
228Figure 1: Variation des tempéra
- Page 251 and 252:
230L’espérance de la matrice de
- Page 253 and 254:
232Tableau 3. Moyennes des caractè
- Page 255 and 256:
234Tableau 6. Table d’ANOVA du mo
- Page 257 and 258:
236Tableau 8. Table d’ANOVA du mo
- Page 259 and 260:
238seconde stratégie répond bien
- Page 261 and 262:
240
- Page 263 and 264:
242
- Page 265 and 266:
244RésuméDes enquêtes sur les ma
- Page 267 and 268:
246Field surveysField surveys were
- Page 269 and 270:
248Table 1.PathogensMean incidence
- Page 271 and 272:
250Table 3. Correlation matrix betw
- Page 273 and 274:
252Table 8. Correlation matrix betw
- Page 275 and 276:
254Signifi cant correlations were f
- Page 277 and 278:
256NCRE, 1994. Annual Report Camero
- Page 279 and 280:
258faibles réactions qui indiquent
- Page 281 and 282:
260(b) A no-choice situation. In th
- Page 283 and 284:
262Table 2. Ovipositional responses
- Page 285 and 286:
264Table 5. Larval feeding response
- Page 287 and 288:
266Figure 1. Profiles of colonizing
- Page 289 and 290:
268on moderately resistant and susc
- Page 291 and 292:
270CCE, (Commission des Communauté
- Page 293 and 294:
272RésuméLe Striga est une contra
- Page 295 and 296:
274the baseline for environmental m
- Page 297 and 298:
276Table 1. Percentage of crop and
- Page 299 and 300:
278(Emechebe et al. 1991) may have
- Page 301 and 302:
280ReferencesAnonymous, 1996. Stati
- Page 303 and 304:
282The use of spicy plant oils agai
- Page 305 and 306:
284The objectives of the present st
- Page 307 and 308:
286% mortality100908070605040302010
- Page 309 and 310:
288saturated atmosphere in the dark
- Page 311 and 312:
290(Gyllenhal) in stored chick-peas
- Page 313 and 314:
292intercropped with groundnut, and
- Page 315 and 316:
294du Striga. Les observations ont
- Page 317 and 318:
296Tableau 1. Incidence des plants
- Page 319 and 320:
298Tableau 4. Contd.LibellésUnité
- Page 321 and 322:
300soudure. Le traitement maïs ass
- Page 323 and 324:
302Herbicide resistant maize: a nov
- Page 325 and 326:
304Figure 1. Striga-prone areas in
- Page 327 and 328:
306developed herbicide resistant li
- Page 329 and 330:
308geo-referenced data from a farm-
- Page 331 and 332:
310Table 2: Grain yield and Striga
- Page 333 and 334:
312AcknowledgementsThis research wa
- Page 335 and 336:
314Effects of maize-cowpea intercro
- Page 337 and 338:
316In Cameroon, maize is commonly i
- Page 339 and 340:
318Table 1. Relative abundance and
- Page 341 and 342:
320Table 4. Maize stem borers’ st
- Page 343 and 344:
322were the predominant predator sp
- Page 345 and 346:
324on insect infestation and the as
- Page 347 and 348:
326Kareiva, P.M., 1983. Finding and
- Page 349 and 350:
328
- Page 351 and 352:
330impliquées dans la production d
- Page 353 and 354:
332Table 1: Scores assigned for fac
- Page 355 and 356:
334Table 2. Characteristics of wome
- Page 357 and 358:
336Table 5. Spearman rank correlati
- Page 359 and 360:
338farmers are given the appropriat
- Page 361 and 362:
340RésuméUne étude combinée de
- Page 363 and 364:
342ZamfaraStateKatsinaStateFigure 1
- Page 365 and 366:
344Table 1. Relative radii of the f
- Page 367 and 368:
346Table 4. Number of crops grown i
- Page 369 and 370:
348Figure 3: Concentric circles ref
- Page 371 and 372:
350No. Maize farmersFigure 4: Facto
- Page 373 and 374:
352Table 8. Trend of farmers rating
- Page 375 and 376:
354Gyasi, K.O, L.N. Abateisina, T.
- Page 377 and 378:
356Bénin. Seed quality was determi
- Page 379 and 380:
358Tableau 1. Moyenne des différen
- Page 381 and 382:
36070000Nombre de plants à I’hec
- Page 383 and 384:
362ISTA (International Seed Testing
- Page 385 and 386:
364Togolese Institute of Agricultur
- Page 387 and 388:
366variété améliorée et un tém
- Page 389 and 390:
368Tableau 2. Cycle des différente
- Page 391 and 392:
370Tableau 6. Rendement des variét
- Page 393 and 394:
372Tableau 7. Evolution des rendeme
- Page 395 and 396:
374300000250000Maïs Mais purMaïs/
- Page 397 and 398:
376- Au niveau des tests associatio
- Page 399 and 400:
378à base de maïs dans le Nord de
- Page 401 and 402:
380Two States (Kaduna and Katsina),
- Page 403 and 404:
382Table 1. Percentage of farm hous
- Page 405 and 406:
384Table 3. Socio-economic factors
- Page 407 and 408:
386AcknowledgementThe authors are g
- Page 409 and 410:
388Unexploited yield and profitabil
- Page 411 and 412:
390and input combinations. A number
- Page 413 and 414:
392The production function in equat
- Page 415 and 416:
394host of socio-economic and insti
- Page 417 and 418:
396Table 3. Frequency distribution
- Page 419 and 420:
398The adjusted R-squared value and
- Page 421 and 422:
400Assefa, A., 1995. Analysis of pr
- Page 423 and 424:
402Socio-economics of community-bas
- Page 425 and 426:
404seed at affordable price to farm
- Page 427 and 428:
406Table 1. Socio-economic profiles
- Page 429 and 430:
408Table 3. Average labor costs and
- Page 431 and 432:
410ReferencesAhmed, B., 1994. Econo
- Page 433 and 434:
412communautaire de semences de ma
- Page 435 and 436:
414producing QPM seed at the commun
- Page 437 and 438:
416Table 1. Cost elements (N/ha) in
- Page 439 and 440:
418Table 3. Gross income (N/ha) fro
- Page 441 and 442:
420Conclusion and RecommendationsTh
- Page 443 and 444:
422Effets de la rotation et de l’
- Page 445 and 446:
424Tableau 1. Caractéristiques phy
- Page 447 and 448:
426Tableau 3. Composition chimique
- Page 449 and 450:
428Figure 1. Evolution des rendemen
- Page 451 and 452:
430Maïs-grain (kg.ha -1 )Maïs-gra
- Page 453 and 454:
432Tableau 9. Successions culturale
- Page 455 and 456:
434Maïs-grain (kg.ha -1 )350030002
- Page 457 and 458:
436
- Page 459 and 460:
438
- Page 461 and 462:
440ont été analysés pour leur co
- Page 463 and 464:
442A=(M’-M) x 100/M + A o(1)where
- Page 465 and 466:
444Table 1. Physicochemical composi
- Page 467 and 468:
446Table 2. Steeping time and varie
- Page 469 and 470:
448germination. In general, the pea
- Page 471 and 472:
450after cooking of maize malted fl
- Page 473 and 474:
452Marero, L. M., E.M. Payuma, A.R.
- Page 475 and 476:
454Effects of wheat flour replaceme
- Page 477 and 478:
456considerably and this is attribu
- Page 479 and 480:
458resulting products (fl ours, dou
- Page 481 and 482:
460Table 1. Physico-chemical proper
- Page 483 and 484:
462CMS 8806 CMS 8704CMS 9015 CMS 85
- Page 485 and 486:
46439.8We ight(g)39.639.439.2390%10
- Page 487 and 488:
466He, H. and R.C. Hoseney, 1991. D
- Page 489 and 490:
468Adaptation et utilisation de var
- Page 491 and 492:
470Figure 1. Distribution mensuelle
- Page 493 and 494:
472chaque semaine. L’essai a dur
- Page 495 and 496:
474Resultats et DiscussionsTests ag
- Page 497 and 498:
476Tableau 2. Proportions des ingr
- Page 499 and 500:
478Tableau 5. Composition de l’al
- Page 501 and 502:
480Tableau 7. Coûts financiers de
- Page 503 and 504:
482des demandeurs à payer et est d
- Page 505 and 506:
484ConclusionNotre étude montre qu
- Page 507 and 508:
486
- Page 509 and 510:
488
- Page 511 and 512:
490Breeding, Seed Production and St
- Page 513 and 514:
4921. Propose approaches/innovation
- Page 515 and 516:
494identifi cation, planning and im
- Page 517:
496


