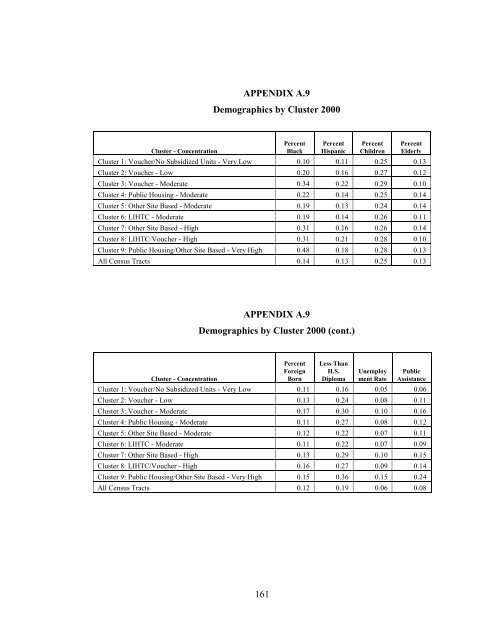
APPENDIX A.8<strong>Subsidized</strong> <strong>Housing</strong> Units by Type by State 2000State State Name Vouchers Public <strong>Housing</strong> Other Site Based LIHTC TotalAL Alabama 44,832 22725 11,763 19,742 99,062AK Alaska 1,371 2352 1,314 2,919 7,956AZ Arizona 7,027 11366 12,105 16,268 46,766AR Arkansas 15,307 15011 8,569 18,702 57,589CA California 45,323 143074 86,246 214,874 489,517CO Colorado 9,175 20530 12,537 21,352 63,594CT Connecticut 17,817 36054 8,319 19,749 81,939DE Delaware 3,168 5565 3,502 2,614 14,849DC District <strong>of</strong> Columbia 10,599 13288 3,776 5,339 33,002FL Florida 44,133 59644 60,817 64,024 228,618GA Georgia 52,473 36175 28,676 36,371 153,695HI Hawaii 5,628 6497 1,937 8,488 22,550ID Idaho 831 4760 4,847 5,520 15,958IL Illinois 75,509 73014 32,076 58,531 239,130IN Indiana 17,895 44978 23,549 25,654 112,076IA Iowa 4,742 16838 11,970 17,686 51,236KS Kansas 9,463 15971 13,833 7,897 47,164KY Kentucky 24,782 28656 9,212 26,486 89,136LA Louisiana 32,666 21763 20,851 25,452 100,732ME Maine 4,144 10057 4,858 9,547 28,606MD Maryland 24,278 40967 22,740 25,135 113,120MA Massachusetts 34,189 74601 27,507 52,549 188,846MI Michigan 25,927 74897 41,889 31,527 174,240MN Minnesota 21,504 39683 15,048 23,544 99,779MS Mississippi 15,746 19417 13,737 14,691 63,591MO Missouri 20,071 35331 28,022 28,975 112,399MT Montana 2,096 6015 2,514 4,358 14,983NE Nebraska 7,465 8728 7,585 7,214 30,992NV Nevada 4,917 4915 6,904 8,687 25,423NH New Hampshire 4,331 7634 3,249 6,911 22,125NJ New Jersey 43,139 54640 11,057 43,106 151,942NM New Mexico 4,864 6751 7,047 10,869 29,531NY New York 196,793 161382 37,771 149,522 545,468NC North Carolina 39,739 31774 25,498 38,740 135,751ND North Dakota 1,898 4248 2,664 5,817 14,627OH Ohio 54,410 90615 49,238 61,121 255,384OK Oklahoma 13,225 14850 15,077 17,347 60,499OR Oregon 6,244 12779 17,780 25,128 61,931PA Pennsylvania 76,659 74475 25,650 54,213 230,997RI Rhode Island 10,095 18007 3,636 6,280 38,018SC South Carolina 16,727 22390 12,322 17,905 69,344SD South Dakota 1,777 6280 3,733 4,277 16,067TN Tennessee 41,630 37937 19,364 22,472 121,403TX Texas 60,610 69804 75,984 100,673 307,071UT Utah 2,265 4554 6,003 7,718 20,540VT Vermont 1,834 3870 3,917 4,924 14,545VA Virginia 22,145 40306 38,096 29,706 130,253WA Washington 16,790 21628 26,214 28,247 92,879WV West Virginia 7,251 12190 4,482 11,725 35,648WI Wisconsin 13,880 36984 20,775 20,275 91,914WY Wyoming 786 2670 1,456 1,844 6,756XX State Unknown - 1095 - 314,803 315,898U.S. Total 1,220,170 1,628,640 937,716 1,472,715 5,259,241Source: HUD, A Picture <strong>of</strong> <strong>Subsidized</strong> <strong>Housing</strong> 2000160
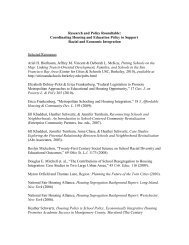
APPENDIX A.9Demographics by Cluster 2000Cluster - <strong>Concentration</strong>PercentBlackPercentHispanicPercentChildrenPercentElderlyCluster 1: Voucher/No <strong>Subsidized</strong> Units - Very Low 0.10 0.11 0.25 0.13Cluster 2: Voucher - Low 0.20 0.16 0.27 0.12Cluster 3: Voucher - Moderate 0.34 0.22 0.29 0.10Cluster 4: Public <strong>Housing</strong> - Moderate 0.22 0.14 0.25 0.14Cluster 5: Other Site Based - Moderate 0.19 0.13 0.24 0.14Cluster 6: LIHTC - Moderate 0.19 0.14 0.26 0.11Cluster 7: Other Site Based - High 0.31 0.16 0.26 0.14Cluster 8: LIHTC/Voucher - High 0.31 0.21 0.28 0.10Cluster 9: Public <strong>Housing</strong>/Other Site Based - Very High 0.48 0.18 0.28 0.13All Census Tracts 0.14 0.13 0.25 0.13APPENDIX A.9Demographics by Cluster 2000 (cont.)Cluster - <strong>Concentration</strong>PercentForeignBornLess ThanH.S.DiplomaUnemployment RatePublicAssistanceCluster 1: Voucher/No <strong>Subsidized</strong> Units - Very Low 0.11 0.16 0.05 0.06Cluster 2: Voucher - Low 0.13 0.24 0.08 0.11Cluster 3: Voucher - Moderate 0.17 0.30 0.10 0.16Cluster 4: Public <strong>Housing</strong> - Moderate 0.11 0.27 0.08 0.12Cluster 5: Other Site Based - Moderate 0.12 0.22 0.07 0.11Cluster 6: LIHTC - Moderate 0.11 0.22 0.07 0.09Cluster 7: Other Site Based - High 0.13 0.29 0.10 0.15Cluster 8: LIHTC/Voucher - High 0.16 0.27 0.09 0.14Cluster 9: Public <strong>Housing</strong>/Other Site Based - Very High 0.15 0.36 0.15 0.24All Census Tracts 0.12 0.19 0.06 0.08161
- Page 1 and 2:
THE SPATIAL CONCENTRATION OF SUBSID
- Page 3 and 4:
I certify that I have read this dis
- Page 5 and 6:
TABLE OF CONTENTSLIST OF TABLES ...
- Page 7 and 8:
6.4 Summary of Cluster Analysis Res
- Page 9 and 10:
Table 5.2 Range of MSA Segregation
- Page 11 and 12:
ABSTRACTSubsidized housing has been
- Page 13 and 14:
Chapter 1INTRODUCTIONPublic housing
- Page 15 and 16:
Data on subsidized housing prior to
- Page 17 and 18:
subsidy programs in that rents are
- Page 19 and 20:
Chapter 2LITERATURE REVIEWA compreh
- Page 21 and 22:
from the nine matched neighborhood
- Page 23 and 24:
Overall, it is clear that there are
- Page 25 and 26:
limited the study to city vs. subur
- Page 27 and 28:
to the public housing, location adj
- Page 29 and 30:
hardship; and 2) public housing wea
- Page 31 and 32:
deconcentrated over time is whether
- Page 33 and 34:
deconcentration. In fact, a higher
- Page 35 and 36:
in the same neighborhood). On avera
- Page 37 and 38:
Concentration of Tenant-Based Subsi
- Page 39 and 40:
Wang, Varady and Wang (2008) studie
- Page 41 and 42:
from the vouchers. However, there w
- Page 43 and 44:
consisting of single family zones,
- Page 45 and 46:
early-mid 1990’s consisting of pu
- Page 47 and 48:
Recent studies of individual housin
- Page 49 and 50:
One of the criticisms of the HOPE V
- Page 51 and 52:
that they are smaller scale, better
- Page 53 and 54:
Chapter 3METHODOLOGYWhile the conce
- Page 55 and 56:
Data AvailabilityA limitation in th
- Page 57 and 58:
just coming on line in the 1990’s
- Page 59 and 60:
with 1,500 to 12,000 the minimum an
- Page 61 and 62:
exclusion of these units is not pro
- Page 63 and 64:
Unduplication of Subsidized UnitsDu
- Page 65:
projects between 35.2 and 46.6 perc
- Page 68 and 69:
Resulting Data for AnalysisAs a res
- Page 70 and 71:
Lack of household level data will l
- Page 72 and 73:
TABLE 4.2Mean Subsidized Housing Un
- Page 74 and 75:
Measures of ConcentrationThree meas
- Page 76 and 77:
TABLE 4.6Subsidized Units as a Perc
- Page 78 and 79:
would have to be to be considered t
- Page 80 and 81:
mean of 82 subsidized units per tra
- Page 82 and 83:
Subsidized Housing by Type and Pove
- Page 84 and 85:
TABLE 4.9Subsidized Units by Subsid
- Page 86 and 87:
unemployment rate (.427), less than
- Page 88 and 89:
TABLE 4.12Correlation Matrix (page
- Page 90 and 91:
TABLE 4.12Correlation Matrix (page
- Page 92 and 93:
spatial sensitivity because many di
- Page 94 and 95:
It is possible that these census tr
- Page 96 and 97:
only 8 MSA’s). The segregation in
- Page 98 and 99:
The correlation between the subsidi
- Page 100 and 101:
developing strategies to deconcentr
- Page 102 and 103:
y subsidy type. The correlation bet
- Page 104 and 105:
with a poverty rate of 9.2 percent.
- Page 106 and 107:
The cluster is relatively small con
- Page 108 and 109:
Cluster 7: Other Site-Based Units -
- Page 110 and 111:
the only cluster that had a signifi
- Page 112 and 113:
alter the perception of public hous
- Page 114 and 115:
VouchersVoucher type tracts are dom
- Page 116 and 117:
TABLE 6.1Subsidized Units by Cluste
- Page 118 and 119:
FIGURE 6.1Percent Census Tracts by
- Page 120 and 121:
FIGURE 6.5Census Tract Percent Rent
- Page 122 and 123: Cluster - Concentration -PovertyCen
- Page 124 and 125: strategies. The cluster map shows t
- Page 126 and 127: FIGURE 6.9Map of Public Housing Uni
- Page 128 and 129: Cluster 1: Voucher/No Subsidized Un
- Page 130 and 131: considered moderately concentrated
- Page 132 and 133: Cluster Analysis ResultsThe cluster
- Page 134 and 135: tracts than other subsidy types it
- Page 136 and 137: ecommend efforts to reduce the leve
- Page 138 and 139: scale at which the impacts occur; 2
- Page 140 and 141: units. Given the high cost of these
- Page 142 and 143: REFERENCESAbt Associates, I. (2006)
- Page 144 and 145: Briggs, X. d. S. (Ed.). (2005). The
- Page 146 and 147: Deng, L. (2007). Comparing the effe
- Page 148 and 149: Ellen, I. G., & Voicu, I. (2005). N
- Page 150 and 151: Galster, G. C. (2005). Consequences
- Page 152 and 153: Harris, L. E. (1999). A home is mor
- Page 154 and 155: Johnson, M. P. (2006). Single-perio
- Page 156 and 157: Lee, B. A., Reardon, S. F., Firebau
- Page 158 and 159: Nguyen, M. T. (2005). Does Affordab
- Page 160 and 161: implementing eight consent decrees.
- Page 162 and 163: Schwartz, A. (1999). New York City
- Page 164 and 165: Varady, D. P., & Walker, C. C. (200
- Page 166 and 167: APPENDIX A.1Downloadable Databases
- Page 168 and 169: APPENDIX A.4Missing DataPublicHousi
- Page 170 and 171: APPENDIX A.6Subsidized Housing Unit
- Page 174 and 175: APPENDIX A.9Demographics by Cluster
- Page 176 and 177: MSAFIPS MSA Name Population Voucher
- Page 178 and 179: MSAFIPS MSA Name Population Voucher
- Page 180 and 181: MSAFIPS MSA Name Population Voucher
- Page 182 and 183: MSAFIPS MSA Name Population Voucher
- Page 184 and 185: MSAFIPS MSA Name Population Voucher
- Page 186 and 187: MSA /PMSA Code MSA / PMSA Name Popu
- Page 188 and 189: MSA /PMSA Code MSA / PMSA Name Popu
- Page 190 and 191: MSA /PMSA Code MSA / PMSA Name Popu
- Page 192 and 193: MSA /PMSA Code MSA / PMSA Name Popu
- Page 194 and 195: MSA /PMSA Code MSA / PMSA Name Popu
- Page 196 and 197: Author Date Data GeographyGalster a
- Page 198 and 199: Author Date Data GeographyHolloway,
- Page 200 and 201: Author Date Data GeographyType ofPr
- Page 202 and 203: Author Date Data GeographyMurray 19
- Page 204 and 205: Author Date Data GeographyLee 20081
- Page 206 and 207: Author Date Data GeographyOakley 20
- Page 208 and 209: Devine, Gray,Rubin andTaghavi (HUD)
- Page 210 and 211: Carlson,Haveman,Kaplan andWolfe 200
- Page 212 and 213: Newman andSchnare 1997Rohe andFreem
- Page 214: Galster andZobel 1998Freeman andBot