- Page 1 and 2:
THE SPATIAL CONCENTRATION OF SUBSID
- Page 3 and 4:
I certify that I have read this dis
- Page 5 and 6:
TABLE OF CONTENTSLIST OF TABLES ...
- Page 7 and 8:
6.4 Summary of Cluster Analysis Res
- Page 9 and 10:
Table 5.2 Range of MSA Segregation
- Page 11 and 12:
ABSTRACTSubsidized housing has been
- Page 13 and 14:
Chapter 1INTRODUCTIONPublic housing
- Page 15 and 16:
Data on subsidized housing prior to
- Page 17 and 18:
subsidy programs in that rents are
- Page 19 and 20:
Chapter 2LITERATURE REVIEWA compreh
- Page 21 and 22: from the nine matched neighborhood
- Page 23 and 24: Overall, it is clear that there are
- Page 25 and 26: limited the study to city vs. subur
- Page 27 and 28: to the public housing, location adj
- Page 29 and 30: hardship; and 2) public housing wea
- Page 31 and 32: deconcentrated over time is whether
- Page 33 and 34: deconcentration. In fact, a higher
- Page 35 and 36: in the same neighborhood). On avera
- Page 37 and 38: Concentration of Tenant-Based Subsi
- Page 39 and 40: Wang, Varady and Wang (2008) studie
- Page 41 and 42: from the vouchers. However, there w
- Page 43 and 44: consisting of single family zones,
- Page 45 and 46: early-mid 1990’s consisting of pu
- Page 47 and 48: Recent studies of individual housin
- Page 49 and 50: One of the criticisms of the HOPE V
- Page 51 and 52: that they are smaller scale, better
- Page 53 and 54: Chapter 3METHODOLOGYWhile the conce
- Page 55 and 56: Data AvailabilityA limitation in th
- Page 57 and 58: just coming on line in the 1990’s
- Page 59 and 60: with 1,500 to 12,000 the minimum an
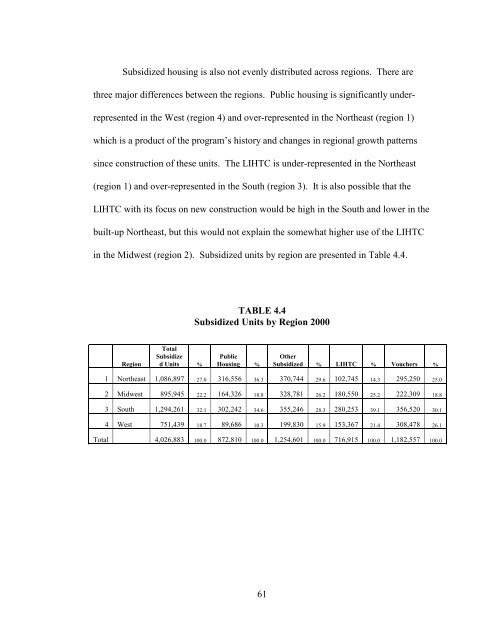
- Page 61 and 62: exclusion of these units is not pro
- Page 63 and 64: Unduplication of Subsidized UnitsDu
- Page 65: projects between 35.2 and 46.6 perc
- Page 68 and 69: Resulting Data for AnalysisAs a res
- Page 70 and 71: Lack of household level data will l
- Page 74 and 75: Measures of ConcentrationThree meas
- Page 76 and 77: TABLE 4.6Subsidized Units as a Perc
- Page 78 and 79: would have to be to be considered t
- Page 80 and 81: mean of 82 subsidized units per tra
- Page 82 and 83: Subsidized Housing by Type and Pove
- Page 84 and 85: TABLE 4.9Subsidized Units by Subsid
- Page 86 and 87: unemployment rate (.427), less than
- Page 88 and 89: TABLE 4.12Correlation Matrix (page
- Page 90 and 91: TABLE 4.12Correlation Matrix (page
- Page 92 and 93: spatial sensitivity because many di
- Page 94 and 95: It is possible that these census tr
- Page 96 and 97: only 8 MSA’s). The segregation in
- Page 98 and 99: The correlation between the subsidi
- Page 100 and 101: developing strategies to deconcentr
- Page 102 and 103: y subsidy type. The correlation bet
- Page 104 and 105: with a poverty rate of 9.2 percent.
- Page 106 and 107: The cluster is relatively small con
- Page 108 and 109: Cluster 7: Other Site-Based Units -
- Page 110 and 111: the only cluster that had a signifi
- Page 112 and 113: alter the perception of public hous
- Page 114 and 115: VouchersVoucher type tracts are dom
- Page 116 and 117: TABLE 6.1Subsidized Units by Cluste
- Page 118 and 119: FIGURE 6.1Percent Census Tracts by
- Page 120 and 121: FIGURE 6.5Census Tract Percent Rent
- Page 122 and 123:
Cluster - Concentration -PovertyCen
- Page 124 and 125:
strategies. The cluster map shows t
- Page 126 and 127:
FIGURE 6.9Map of Public Housing Uni
- Page 128 and 129:
Cluster 1: Voucher/No Subsidized Un
- Page 130 and 131:
considered moderately concentrated
- Page 132 and 133:
Cluster Analysis ResultsThe cluster
- Page 134 and 135:
tracts than other subsidy types it
- Page 136 and 137:
ecommend efforts to reduce the leve
- Page 138 and 139:
scale at which the impacts occur; 2
- Page 140 and 141:
units. Given the high cost of these
- Page 142 and 143:
REFERENCESAbt Associates, I. (2006)
- Page 144 and 145:
Briggs, X. d. S. (Ed.). (2005). The
- Page 146 and 147:
Deng, L. (2007). Comparing the effe
- Page 148 and 149:
Ellen, I. G., & Voicu, I. (2005). N
- Page 150 and 151:
Galster, G. C. (2005). Consequences
- Page 152 and 153:
Harris, L. E. (1999). A home is mor
- Page 154 and 155:
Johnson, M. P. (2006). Single-perio
- Page 156 and 157:
Lee, B. A., Reardon, S. F., Firebau
- Page 158 and 159:
Nguyen, M. T. (2005). Does Affordab
- Page 160 and 161:
implementing eight consent decrees.
- Page 162 and 163:
Schwartz, A. (1999). New York City
- Page 164 and 165:
Varady, D. P., & Walker, C. C. (200
- Page 166 and 167:
APPENDIX A.1Downloadable Databases
- Page 168 and 169:
APPENDIX A.4Missing DataPublicHousi
- Page 170 and 171:
APPENDIX A.6Subsidized Housing Unit
- Page 172 and 173:
APPENDIX A.8Subsidized Housing Unit
- Page 174 and 175:
APPENDIX A.9Demographics by Cluster
- Page 176 and 177:
MSAFIPS MSA Name Population Voucher
- Page 178 and 179:
MSAFIPS MSA Name Population Voucher
- Page 180 and 181:
MSAFIPS MSA Name Population Voucher
- Page 182 and 183:
MSAFIPS MSA Name Population Voucher
- Page 184 and 185:
MSAFIPS MSA Name Population Voucher
- Page 186 and 187:
MSA /PMSA Code MSA / PMSA Name Popu
- Page 188 and 189:
MSA /PMSA Code MSA / PMSA Name Popu
- Page 190 and 191:
MSA /PMSA Code MSA / PMSA Name Popu
- Page 192 and 193:
MSA /PMSA Code MSA / PMSA Name Popu
- Page 194 and 195:
MSA /PMSA Code MSA / PMSA Name Popu
- Page 196 and 197:
Author Date Data GeographyGalster a
- Page 198 and 199:
Author Date Data GeographyHolloway,
- Page 200 and 201:
Author Date Data GeographyType ofPr
- Page 202 and 203:
Author Date Data GeographyMurray 19
- Page 204 and 205:
Author Date Data GeographyLee 20081
- Page 206 and 207:
Author Date Data GeographyOakley 20
- Page 208 and 209:
Devine, Gray,Rubin andTaghavi (HUD)
- Page 210 and 211:
Carlson,Haveman,Kaplan andWolfe 200
- Page 212 and 213:
Newman andSchnare 1997Rohe andFreem
- Page 214:
Galster andZobel 1998Freeman andBot