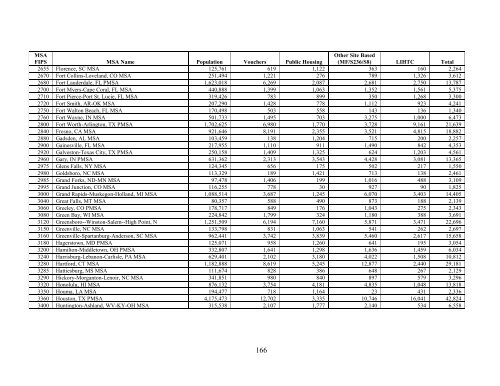
MSAFIPS MSA Name Population Vouchers Public <strong>Housing</strong>Other Site Based(MF/S236/S8) LIHTC Total2655 Florence, SC MSA 125,761 619 1,122 363 160 2,2642670 Fort Collins-Loveland, CO MSA 251,494 1,221 276 789 1,326 3,6122680 Fort Lauderdale, FL PMSA 1,623,018 6,269 2,087 2,681 2,750 13,7872700 Fort Myers-Cape Coral, FL MSA 440,888 1,399 1,063 1,352 1,561 5,3752710 Fort Pierce-Port St. Lucie, FL MSA 319,426 783 899 350 1,268 3,3002720 Fort Smith, AR-OK MSA 207,290 1,428 778 1,112 923 4,2412750 Fort Walton Beach, FL MSA 170,498 503 558 143 136 1,3402760 Fort Wayne, IN MSA 501,733 1,495 703 3,275 1,000 6,4732800 Fort Worth-Arlington, TX PMSA 1,702,625 6,980 1,770 3,728 9,161 21,6392840 Fresno, CA MSA 921,646 8,191 2,355 3,521 4,815 18,8822880 Gadsden, AL MSA 103,459 138 1,204 715 200 2,2572900 Gainesville, FL MSA 217,955 1,110 911 1,490 842 4,3532920 Galveston-Texas City, TX PMSA 250,158 1,409 1,325 624 1,203 4,5612960 Gary, IN PMSA 631,362 2,313 3,543 4,428 3,081 13,3652975 Glens Falls, NY MSA 124,345 656 175 502 217 1,5502980 Goldsboro, NC MSA 113,329 189 1,421 713 138 2,4612985 Grand Forks, ND-MN MSA 97,478 1,406 199 1,016 488 3,1092995 Grand Junction, CO MSA 116,255 778 30 927 90 1,8253000 Grand Rapids-Muskegon-Holland, MI MSA 1,088,514 3,687 1,245 6,070 3,403 14,4053040 Great Falls, MT MSA 80,357 588 490 873 188 2,1393060 Greeley, CO PMSA 178,717 849 176 1,043 275 2,3433080 Green Bay, WI MSA 224,842 1,799 324 1,180 388 3,6913120 Greensboro--Winston-Salem--High Point, N 1,251,509 6,194 7,160 5,871 3,471 22,6963150 Greenville, NC MSA 133,798 831 1,063 541 262 2,6973160 Greenville-Spartanburg-Anderson, SC MSA 962,441 3,742 3,839 5,460 2,617 15,6583180 Hagerstown, MD PMSA 125,071 958 1,260 641 195 3,0543200 Hamilton-Middletown, OH PMSA 332,807 1,641 1,298 1,636 1,459 6,0343240 Harrisburg-Lebanon-Carlisle, PA MSA 629,401 2,102 3,180 4,022 1,508 10,8123280 Hartford, CT MSA 1,182,888 8,619 5,245 12,877 2,440 29,1813285 Hattiesburg, MS MSA 111,674 828 386 648 267 2,1293290 Hickory-Morganton-Lenoir, NC MSA 341,851 980 840 897 579 3,2963320 Honolulu, HI MSA 876,132 3,754 4,181 4,835 1,048 13,8183350 Houma, LA MSA 194,477 718 1,164 23 431 2,3363360 Houston, TX PMSA 4,175,473 12,702 3,335 10,746 16,041 42,8243400 Huntington-Ashland, WV-KY-OH MSA 315,538 2,107 1,777 2,140 534 6,558166
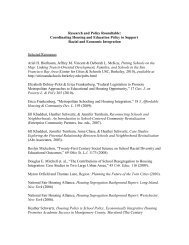
MSAFIPS MSA Name Population Vouchers Public <strong>Housing</strong>Other Site Based(MF/S236/S8) LIHTC Total3440 Huntsville, AL MSA 342,376 737 1,867 1,369 897 4,8703480 Indianapolis, IN MSA 1,607,486 6,085 2,102 11,336 7,750 27,2733500 Iowa City, IA MSA 111,006 1,066 121 675 326 2,1883520 Jackson, MI MSA 155,428 590 553 1,029 517 2,6893560 Jackson, MS MSA 440,801 3,523 756 4,016 3,418 11,7133580 Jackson, TN MSA 107,377 814 1,027 810 397 3,0483600 Jacksonville, FL MSA 1,100,491 5,672 2,922 7,832 5,302 21,7283605 Jacksonville, NC MSA 150,355 338 21 400 779 1,5383610 Jamestown, NY MSA 139,750 778 450 880 98 2,2063620 Janesville-Beloit, WI MSA 152,307 940 235 866 769 2,8103640 Jersey City, NJ PMSA 608,975 5,933 8,953 6,750 577 22,2133660 Johnson City-Kingsport-Bristol, TN-VA MS 480,091 1,803 2,861 3,043 751 8,4583680 Johnstown, PA MSA 232,621 544 1,868 1,316 256 3,9843700 Jonesboro, AR MSA 82,148 1,194 290 570 264 2,3183710 Joplin, MO MSA 157,322 705 462 811 1,320 3,2983720 Kalamazoo-Battle Creek, MI MSA 452,851 1,112 932 4,037 2,543 8,6243740 Kankakee, IL PMSA 103,833 505 326 467 203 1,5013760 Kansas City, MO-KS MSA 1,775,751 8,846 4,718 15,873 12,321 41,7583800 Kenosha, WI PMSA 149,577 934 - 1,182 690 2,8063810 Killeen-Temple, TX MSA 312,952 1,945 916 576 768 4,2053840 Knoxville, TN MSA 687,017 3,505 5,112 4,811 839 14,2673850 Kokomo, IN MSA 101,541 554 560 621 421 2,1563870 La Crosse, WI-MN MSA 126,838 217 735 662 374 1,9883880 Lafayette, LA MSA 385,647 2,166 2,742 1,740 1,492 8,1403920 Lafayette, IN MSA 176,004 844 - 2,043 662 3,5493960 Lake Charles, LA MSA 183,577 1,725 1,201 867 464 4,2573980 Lakeland-Winter Haven, FL MSA 483,924 1,286 1,327 1,879 829 5,3214000 Lancaster, PA MSA 470,658 1,397 564 1,595 847 4,4034040 Lansing-East Lansing, MI MSA 447,728 1,268 1,022 3,534 1,770 7,5944080 Laredo, TX MSA 193,117 1,159 962 602 127 2,8504100 Las Cruces, NM MSA 174,682 611 415 633 445 2,1044120 Las Vegas, NV-AZ MSA 1,563,282 6,211 3,251 2,699 5,563 17,7244150 Lawrence, KS MSA 99,962 429 369 436 398 1,6324160 Lawrence, MA-NH PMSA 396,230 2,506 1,341 3,685 1,298 8,8304200 Lawton, OK MSA 114,996 957 387 454 16 1,814167
- Page 1 and 2:
THE SPATIAL CONCENTRATION OF SUBSID
- Page 3 and 4:
I certify that I have read this dis
- Page 5 and 6:
TABLE OF CONTENTSLIST OF TABLES ...
- Page 7 and 8:
6.4 Summary of Cluster Analysis Res
- Page 9 and 10:
Table 5.2 Range of MSA Segregation
- Page 11 and 12:
ABSTRACTSubsidized housing has been
- Page 13 and 14:
Chapter 1INTRODUCTIONPublic housing
- Page 15 and 16:
Data on subsidized housing prior to
- Page 17 and 18:
subsidy programs in that rents are
- Page 19 and 20:
Chapter 2LITERATURE REVIEWA compreh
- Page 21 and 22:
from the nine matched neighborhood
- Page 23 and 24:
Overall, it is clear that there are
- Page 25 and 26:
limited the study to city vs. subur
- Page 27 and 28:
to the public housing, location adj
- Page 29 and 30:
hardship; and 2) public housing wea
- Page 31 and 32:
deconcentrated over time is whether
- Page 33 and 34:
deconcentration. In fact, a higher
- Page 35 and 36:
in the same neighborhood). On avera
- Page 37 and 38:
Concentration of Tenant-Based Subsi
- Page 39 and 40:
Wang, Varady and Wang (2008) studie
- Page 41 and 42:
from the vouchers. However, there w
- Page 43 and 44:
consisting of single family zones,
- Page 45 and 46:
early-mid 1990’s consisting of pu
- Page 47 and 48:
Recent studies of individual housin
- Page 49 and 50:
One of the criticisms of the HOPE V
- Page 51 and 52:
that they are smaller scale, better
- Page 53 and 54:
Chapter 3METHODOLOGYWhile the conce
- Page 55 and 56:
Data AvailabilityA limitation in th
- Page 57 and 58:
just coming on line in the 1990’s
- Page 59 and 60:
with 1,500 to 12,000 the minimum an
- Page 61 and 62:
exclusion of these units is not pro
- Page 63 and 64:
Unduplication of Subsidized UnitsDu
- Page 65:
projects between 35.2 and 46.6 perc
- Page 68 and 69:
Resulting Data for AnalysisAs a res
- Page 70 and 71:
Lack of household level data will l
- Page 72 and 73:
TABLE 4.2Mean Subsidized Housing Un
- Page 74 and 75:
Measures of ConcentrationThree meas
- Page 76 and 77:
TABLE 4.6Subsidized Units as a Perc
- Page 78 and 79:
would have to be to be considered t
- Page 80 and 81:
mean of 82 subsidized units per tra
- Page 82 and 83:
Subsidized Housing by Type and Pove
- Page 84 and 85:
TABLE 4.9Subsidized Units by Subsid
- Page 86 and 87:
unemployment rate (.427), less than
- Page 88 and 89:
TABLE 4.12Correlation Matrix (page
- Page 90 and 91:
TABLE 4.12Correlation Matrix (page
- Page 92 and 93:
spatial sensitivity because many di
- Page 94 and 95:
It is possible that these census tr
- Page 96 and 97:
only 8 MSA’s). The segregation in
- Page 98 and 99:
The correlation between the subsidi
- Page 100 and 101:
developing strategies to deconcentr
- Page 102 and 103:
y subsidy type. The correlation bet
- Page 104 and 105:
with a poverty rate of 9.2 percent.
- Page 106 and 107:
The cluster is relatively small con
- Page 108 and 109:
Cluster 7: Other Site-Based Units -
- Page 110 and 111:
the only cluster that had a signifi
- Page 112 and 113:
alter the perception of public hous
- Page 114 and 115:
VouchersVoucher type tracts are dom
- Page 116 and 117:
TABLE 6.1Subsidized Units by Cluste
- Page 118 and 119:
FIGURE 6.1Percent Census Tracts by
- Page 120 and 121:
FIGURE 6.5Census Tract Percent Rent
- Page 122 and 123:
Cluster - Concentration -PovertyCen
- Page 124 and 125:
strategies. The cluster map shows t
- Page 126 and 127:
FIGURE 6.9Map of Public Housing Uni
- Page 128 and 129: Cluster 1: Voucher/No Subsidized Un
- Page 130 and 131: considered moderately concentrated
- Page 132 and 133: Cluster Analysis ResultsThe cluster
- Page 134 and 135: tracts than other subsidy types it
- Page 136 and 137: ecommend efforts to reduce the leve
- Page 138 and 139: scale at which the impacts occur; 2
- Page 140 and 141: units. Given the high cost of these
- Page 142 and 143: REFERENCESAbt Associates, I. (2006)
- Page 144 and 145: Briggs, X. d. S. (Ed.). (2005). The
- Page 146 and 147: Deng, L. (2007). Comparing the effe
- Page 148 and 149: Ellen, I. G., & Voicu, I. (2005). N
- Page 150 and 151: Galster, G. C. (2005). Consequences
- Page 152 and 153: Harris, L. E. (1999). A home is mor
- Page 154 and 155: Johnson, M. P. (2006). Single-perio
- Page 156 and 157: Lee, B. A., Reardon, S. F., Firebau
- Page 158 and 159: Nguyen, M. T. (2005). Does Affordab
- Page 160 and 161: implementing eight consent decrees.
- Page 162 and 163: Schwartz, A. (1999). New York City
- Page 164 and 165: Varady, D. P., & Walker, C. C. (200
- Page 166 and 167: APPENDIX A.1Downloadable Databases
- Page 168 and 169: APPENDIX A.4Missing DataPublicHousi
- Page 170 and 171: APPENDIX A.6Subsidized Housing Unit
- Page 172 and 173: APPENDIX A.8Subsidized Housing Unit
- Page 174 and 175: APPENDIX A.9Demographics by Cluster
- Page 176 and 177: MSAFIPS MSA Name Population Voucher
- Page 180 and 181: MSAFIPS MSA Name Population Voucher
- Page 182 and 183: MSAFIPS MSA Name Population Voucher
- Page 184 and 185: MSAFIPS MSA Name Population Voucher
- Page 186 and 187: MSA /PMSA Code MSA / PMSA Name Popu
- Page 188 and 189: MSA /PMSA Code MSA / PMSA Name Popu
- Page 190 and 191: MSA /PMSA Code MSA / PMSA Name Popu
- Page 192 and 193: MSA /PMSA Code MSA / PMSA Name Popu
- Page 194 and 195: MSA /PMSA Code MSA / PMSA Name Popu
- Page 196 and 197: Author Date Data GeographyGalster a
- Page 198 and 199: Author Date Data GeographyHolloway,
- Page 200 and 201: Author Date Data GeographyType ofPr
- Page 202 and 203: Author Date Data GeographyMurray 19
- Page 204 and 205: Author Date Data GeographyLee 20081
- Page 206 and 207: Author Date Data GeographyOakley 20
- Page 208 and 209: Devine, Gray,Rubin andTaghavi (HUD)
- Page 210 and 211: Carlson,Haveman,Kaplan andWolfe 200
- Page 212 and 213: Newman andSchnare 1997Rohe andFreem
- Page 214: Galster andZobel 1998Freeman andBot