The Spatial Concentration of Subsidized Housing - Poverty & Race ...
The Spatial Concentration of Subsidized Housing - Poverty & Race ...
The Spatial Concentration of Subsidized Housing - Poverty & Race ...
Create successful ePaper yourself
Turn your PDF publications into a flip-book with our unique Google optimized e-Paper software.
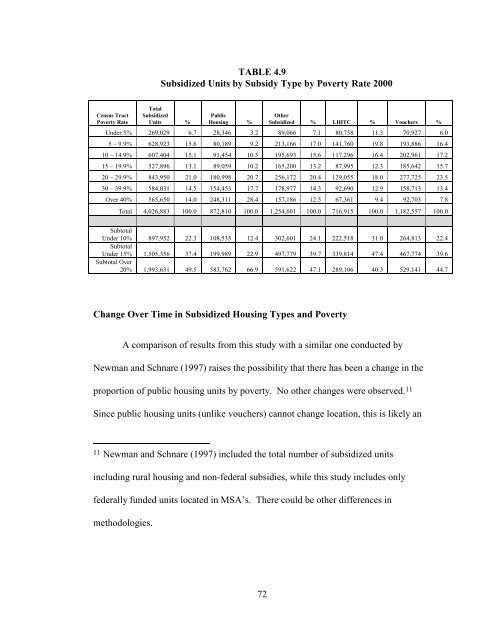
TABLE 4.9<strong>Subsidized</strong> Units by Subsidy Type by <strong>Poverty</strong> Rate 2000Census Tract<strong>Poverty</strong> RateTotal<strong>Subsidized</strong>Units %Public<strong>Housing</strong> %Other<strong>Subsidized</strong> % LIHTC % Vouchers %Under 5% 269,029 6.7 28,346 3.2 89,066 7.1 80,758 11.3 70,927 6.05 – 9.9% 628,923 15.6 80,189 9.2 213,166 17.0 141,760 19.8 193,886 16.410 – 14.9% 607,404 15.1 91,454 10.5 195,693 15.6 117,296 16.4 202,961 17.215 – 19.9% 527,896 13.1 89,059 10.2 165,200 13.2 87,995 12.3 185,642 15.720 – 29.9% 843,950 21.0 180,998 20.7 256,172 20.4 129,055 18.0 277,725 23.530 – 39.9% 584,031 14.5 154,453 17.7 178,977 14.3 92,690 12.9 158,713 13.4Over 40% 565,650 14.0 248,311 28.4 157,186 12.5 67,361 9.4 92,703 7.8Total 4,026,883 100.0 872,810 100.0 1,254,601 100.0 716,915 100.0 1,182,557 100.0SubtotalUnder 10% 897,952 22.3 108,535 12.4 302,601 24.1 222,518 31.0 264,813 22.4SubtotalUnder 15% 1,505,356 37.4 199,989 22.9 497,779 39.7 339,814 47.4 467,774 39.6Subtotal Over20% 1,993,631 49.5 583,762 66.9 591,622 47.1 289,106 40.3 529,141 44.7Change Over Time in <strong>Subsidized</strong> <strong>Housing</strong> Types and <strong>Poverty</strong>A comparison <strong>of</strong> results from this study with a similar one conducted byNewman and Schnare (1997) raises the possibility that there has been a change in theproportion <strong>of</strong> public housing units by poverty. No other changes were observed. 11Since public housing units (unlike vouchers) cannot change location, this is likely an11 Newman and Schnare (1997) included the total number <strong>of</strong> subsidized unitsincluding rural housing and non-federal subsidies, while this study includes onlyfederally funded units located in MSA’s. <strong>The</strong>re could be other differences inmethodologies.72


