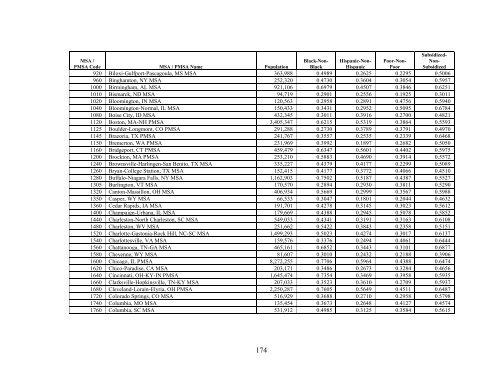
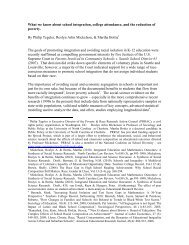
MSA /PMSA Code MSA / PMSA Name PopulationBlack-Non-BlackHispanic-Non-HispanicPoor-Non-Poor<strong>Subsidized</strong>-Non-<strong>Subsidized</strong>920 Biloxi-Gulfport-Pascagoula, MS MSA 363,988 0.4989 0.2625 0.2295 0.5006960 Binghamton, NY MSA 252,320 0.4730 0.3604 0.3054 0.59571000 Birmingham, AL MSA 921,106 0.6979 0.4507 0.3846 0.62511010 Bismarck, ND MSA 94,719 0.2901 0.2556 0.1925 0.30111020 Bloomington, IN MSA 120,563 0.2958 0.2891 0.4756 0.59401040 Bloomington-Normal, IL MSA 150,433 0.3431 0.2952 0.5095 0.67841080 Boise City, ID MSA 432,345 0.3011 0.3916 0.2700 0.48211120 Boston, MA-NH PMSA 3,405,347 0.6215 0.5319 0.3864 0.55931125 Boulder-Longmont, CO PMSA 291,288 0.2730 0.3789 0.3791 0.49701145 Brazoria, TX PMSA 241,767 0.3557 0.2535 0.2339 0.64681150 Bremerton, WA PMSA 231,969 0.3992 0.1897 0.2682 0.50501160 Bridgeport, CT PMSA 459,479 0.6347 0.5601 0.4402 0.59751200 Brockton, MA PMSA 253,210 0.5883 0.4690 0.3914 0.55721240 Brownsville-Harlingen-San Benito, TX MSA 335,227 0.4379 0.4177 0.2299 0.50891260 Bryan-College Station, TX MSA 152,415 0.4177 0.3772 0.4066 0.45101280 Buffalo-Niagara Falls, NY MSA 1,162,903 0.7502 0.5187 0.4387 0.55271305 Burlington, VT MSA 170,570 0.2894 0.2930 0.3811 0.52901320 Canton-Massillon, OH MSA 406,934 0.5669 0.2999 0.3567 0.59881350 Casper, WY MSA 66,533 0.3047 0.1801 0.2044 0.46321360 Cedar Rapids, IA MSA 191,701 0.4278 0.3145 0.3023 0.56121400 Champaign-Urbana, IL MSA 179,669 0.4388 0.2945 0.5078 0.58521440 Charleston-North Charleston, SC MSA 549,033 0.4341 0.3191 0.3163 0.61081480 Charleston, WV MSA 251,662 0.5422 0.3843 0.2358 0.51511520 Charlotte-Gastonia-Rock Hill, NC-SC MSA 1,499,293 0.5023 0.4274 0.3017 0.61371540 Charlottesville, VA MSA 159,576 0.3376 0.2494 0.4061 0.64441560 Chattanooga, TN-GA MSA 465,161 0.6852 0.3443 0.3101 0.68771580 Cheyenne, WY MSA 81,607 0.3010 0.2432 0.2188 0.39061600 Chicago, IL PMSA 8,272,255 0.7706 0.5964 0.4388 0.64741620 Chico-Paradise, CA MSA 203,171 0.3486 0.2673 0.3284 0.46561640 Cincinnati, OH-KY-IN PMSA 1,645,474 0.7354 0.3469 0.3958 0.59351660 Clarksville-Hopkinsville, TN-KY MSA 207,033 0.3523 0.3610 0.2709 0.59371680 Cleveland-Lorain-Elyria, OH PMSA 2,250,287 0.7605 0.5649 0.4511 0.64871720 Colorado Springs, CO MSA 516,929 0.3688 0.2710 0.2958 0.57981740 Columbia, MO MSA 135,454 0.3673 0.2648 0.4127 0.45741760 Columbia, SC MSA 531,912 0.4985 0.3125 0.3584 0.5615174
MSA /PMSA Code MSA / PMSA Name PopulationBlack-Non-BlackHispanic-Non-HispanicPoor-Non-Poor<strong>Subsidized</strong>-Non-<strong>Subsidized</strong>1800 Columbus, GA-AL MSA 272,985 0.5589 0.3747 0.3800 0.61691840 Columbus, OH MSA 1,540,157 0.6064 0.3625 0.4133 0.60401880 Corpus Christi, TX MSA 380,783 0.3529 0.4280 0.3105 0.56681890 Corvallis, OR MSA 78,153 0.2690 0.2489 0.4175 0.42001900 Cumberland, MD-WV MSA 102,008 0.4824 0.3738 0.2344 0.47171920 Dallas, TX PMSA 3,519,176 0.5310 0.4858 0.3715 0.65261930 Danbury, CT PMSA 217,980 0.4564 0.5024 0.3389 0.70701950 Danville, VA MSA 110,156 0.3374 0.3948 0.2366 0.55911960 Davenport-Moline-Rock Island, IA-IL MSA 359,062 0.5074 0.3654 0.3220 0.53162000 Dayton-Springfield, OH MSA 950,558 0.6933 0.3087 0.4044 0.51552020 Daytona Beach, FL MSA 493,175 0.5412 0.4077 0.2622 0.65292030 Decatur, AL MSA 145,867 0.5579 0.5268 0.2500 0.55372040 Decatur, IL MSA 114,706 0.5386 0.3576 0.4249 0.54272080 Denver, CO PMSA 2,106,735 0.5787 0.4693 0.3909 0.61472120 Des Moines, IA MSA 456,022 0.5288 0.4422 0.3362 0.54982160 Detroit, MI PMSA 4,439,627 0.8352 0.4517 0.4478 0.67892180 Dothan, AL MSA 137,916 0.4056 0.3876 0.2156 0.44062190 Dover, DE MSA 126,697 0.3228 0.1983 0.1728 0.59842200 Dubuque, IA MSA 89,143 0.4453 0.4439 0.2710 0.47392240 Duluth-Superior, MN-WI MSA 243,815 0.4965 0.3245 0.2860 0.54712281 Dutchess County, NY PMSA 280,150 0.5110 0.2969 0.3438 0.66102290 Eau Claire, WI MSA 148,337 0.3759 0.2907 0.3325 0.41862320 El Paso, TX MSA 679,622 0.4233 0.4489 0.2952 0.54262330 Elkhart-Goshen, IN MSA 182,791 0.5414 0.4254 0.2226 0.57542335 Elmira, NY MSA 91,070 0.4935 0.4281 0.3252 0.61822340 Enid, OK MSA 57,813 0.2744 0.4080 0.2642 0.49982360 Erie, PA MSA 280,843 0.6315 0.4903 0.3758 0.54312400 Eugene-Springfield, OR MSA 322,959 0.2802 0.2330 0.2754 0.46382440 Evansville-Henderson, IN-KY MSA 296,195 0.5716 0.3363 0.3594 0.56192520 Fargo-Moorhead, ND-MN MSA 174,367 0.4024 0.3298 0.2978 0.42462560 Fayetteville, NC MSA 302,963 0.2991 0.2468 0.2406 0.50692580 Fayetteville-Springdale-Rogers, AR MSA 311,121 0.4870 0.4412 0.2430 0.52962600 Fitchburg-Leominster, MA PMSA 140,448 0.3027 0.4088 0.2782 0.53762620 Flagstaff, AZ-UT MSA 122,366 0.3633 0.3781 0.3423 0.62952640 Flint, MI PMSA 436,141 0.7591 0.2855 0.4217 0.6270175
- Page 1 and 2:
THE SPATIAL CONCENTRATION OF SUBSID
- Page 3 and 4:
I certify that I have read this dis
- Page 5 and 6:
TABLE OF CONTENTSLIST OF TABLES ...
- Page 7 and 8:
6.4 Summary of Cluster Analysis Res
- Page 9 and 10:
Table 5.2 Range of MSA Segregation
- Page 11 and 12:
ABSTRACTSubsidized housing has been
- Page 13 and 14:
Chapter 1INTRODUCTIONPublic housing
- Page 15 and 16:
Data on subsidized housing prior to
- Page 17 and 18:
subsidy programs in that rents are
- Page 19 and 20:
Chapter 2LITERATURE REVIEWA compreh
- Page 21 and 22:
from the nine matched neighborhood
- Page 23 and 24:
Overall, it is clear that there are
- Page 25 and 26:
limited the study to city vs. subur
- Page 27 and 28:
to the public housing, location adj
- Page 29 and 30:
hardship; and 2) public housing wea
- Page 31 and 32:
deconcentrated over time is whether
- Page 33 and 34:
deconcentration. In fact, a higher
- Page 35 and 36:
in the same neighborhood). On avera
- Page 37 and 38:
Concentration of Tenant-Based Subsi
- Page 39 and 40:
Wang, Varady and Wang (2008) studie
- Page 41 and 42:
from the vouchers. However, there w
- Page 43 and 44:
consisting of single family zones,
- Page 45 and 46:
early-mid 1990’s consisting of pu
- Page 47 and 48:
Recent studies of individual housin
- Page 49 and 50:
One of the criticisms of the HOPE V
- Page 51 and 52:
that they are smaller scale, better
- Page 53 and 54:
Chapter 3METHODOLOGYWhile the conce
- Page 55 and 56:
Data AvailabilityA limitation in th
- Page 57 and 58:
just coming on line in the 1990’s
- Page 59 and 60:
with 1,500 to 12,000 the minimum an
- Page 61 and 62:
exclusion of these units is not pro
- Page 63 and 64:
Unduplication of Subsidized UnitsDu
- Page 65:
projects between 35.2 and 46.6 perc
- Page 68 and 69:
Resulting Data for AnalysisAs a res
- Page 70 and 71:
Lack of household level data will l
- Page 72 and 73:
TABLE 4.2Mean Subsidized Housing Un
- Page 74 and 75:
Measures of ConcentrationThree meas
- Page 76 and 77:
TABLE 4.6Subsidized Units as a Perc
- Page 78 and 79:
would have to be to be considered t
- Page 80 and 81:
mean of 82 subsidized units per tra
- Page 82 and 83:
Subsidized Housing by Type and Pove
- Page 84 and 85:
TABLE 4.9Subsidized Units by Subsid
- Page 86 and 87:
unemployment rate (.427), less than
- Page 88 and 89:
TABLE 4.12Correlation Matrix (page
- Page 90 and 91:
TABLE 4.12Correlation Matrix (page
- Page 92 and 93:
spatial sensitivity because many di
- Page 94 and 95:
It is possible that these census tr
- Page 96 and 97:
only 8 MSA’s). The segregation in
- Page 98 and 99:
The correlation between the subsidi
- Page 100 and 101:
developing strategies to deconcentr
- Page 102 and 103:
y subsidy type. The correlation bet
- Page 104 and 105:
with a poverty rate of 9.2 percent.
- Page 106 and 107:
The cluster is relatively small con
- Page 108 and 109:
Cluster 7: Other Site-Based Units -
- Page 110 and 111:
the only cluster that had a signifi
- Page 112 and 113:
alter the perception of public hous
- Page 114 and 115:
VouchersVoucher type tracts are dom
- Page 116 and 117:
TABLE 6.1Subsidized Units by Cluste
- Page 118 and 119:
FIGURE 6.1Percent Census Tracts by
- Page 120 and 121:
FIGURE 6.5Census Tract Percent Rent
- Page 122 and 123:
Cluster - Concentration -PovertyCen
- Page 124 and 125:
strategies. The cluster map shows t
- Page 126 and 127:
FIGURE 6.9Map of Public Housing Uni
- Page 128 and 129:
Cluster 1: Voucher/No Subsidized Un
- Page 130 and 131:
considered moderately concentrated
- Page 132 and 133:
Cluster Analysis ResultsThe cluster
- Page 134 and 135:
tracts than other subsidy types it
- Page 136 and 137: ecommend efforts to reduce the leve
- Page 138 and 139: scale at which the impacts occur; 2
- Page 140 and 141: units. Given the high cost of these
- Page 142 and 143: REFERENCESAbt Associates, I. (2006)
- Page 144 and 145: Briggs, X. d. S. (Ed.). (2005). The
- Page 146 and 147: Deng, L. (2007). Comparing the effe
- Page 148 and 149: Ellen, I. G., & Voicu, I. (2005). N
- Page 150 and 151: Galster, G. C. (2005). Consequences
- Page 152 and 153: Harris, L. E. (1999). A home is mor
- Page 154 and 155: Johnson, M. P. (2006). Single-perio
- Page 156 and 157: Lee, B. A., Reardon, S. F., Firebau
- Page 158 and 159: Nguyen, M. T. (2005). Does Affordab
- Page 160 and 161: implementing eight consent decrees.
- Page 162 and 163: Schwartz, A. (1999). New York City
- Page 164 and 165: Varady, D. P., & Walker, C. C. (200
- Page 166 and 167: APPENDIX A.1Downloadable Databases
- Page 168 and 169: APPENDIX A.4Missing DataPublicHousi
- Page 170 and 171: APPENDIX A.6Subsidized Housing Unit
- Page 172 and 173: APPENDIX A.8Subsidized Housing Unit
- Page 174 and 175: APPENDIX A.9Demographics by Cluster
- Page 176 and 177: MSAFIPS MSA Name Population Voucher
- Page 178 and 179: MSAFIPS MSA Name Population Voucher
- Page 180 and 181: MSAFIPS MSA Name Population Voucher
- Page 182 and 183: MSAFIPS MSA Name Population Voucher
- Page 184 and 185: MSAFIPS MSA Name Population Voucher
- Page 188 and 189: MSA /PMSA Code MSA / PMSA Name Popu
- Page 190 and 191: MSA /PMSA Code MSA / PMSA Name Popu
- Page 192 and 193: MSA /PMSA Code MSA / PMSA Name Popu
- Page 194 and 195: MSA /PMSA Code MSA / PMSA Name Popu
- Page 196 and 197: Author Date Data GeographyGalster a
- Page 198 and 199: Author Date Data GeographyHolloway,
- Page 200 and 201: Author Date Data GeographyType ofPr
- Page 202 and 203: Author Date Data GeographyMurray 19
- Page 204 and 205: Author Date Data GeographyLee 20081
- Page 206 and 207: Author Date Data GeographyOakley 20
- Page 208 and 209: Devine, Gray,Rubin andTaghavi (HUD)
- Page 210 and 211: Carlson,Haveman,Kaplan andWolfe 200
- Page 212 and 213: Newman andSchnare 1997Rohe andFreem
- Page 214: Galster andZobel 1998Freeman andBot