Brand-South Africa - Annual report 2015 - 2016
During the past financial year, aligned with its mandate to build pride and patriotism in the Nation Brand, Brand South Africa has worked on initiatives to encourage active citizenship in partnership with its stakeholders in government, business, civil society and identified influential forums to increase the participation of all people, particularly our young people, in building a strong, cohesive Nation Brand. These activities, together with engagements at provincial level on Nation Brand alignment, contribute to social cohesion and a positive Nation Brand. Brand South Africa’s activities took place under the leadership of its new CEO, Amb. Kingsley Makhubela, PhD, who joined the organisation during the year.
During the past financial year, aligned with its mandate to build pride and patriotism in the Nation Brand, Brand South Africa has worked on initiatives to encourage active citizenship in partnership with its stakeholders in government, business, civil society and identified influential forums to increase the participation of all people, particularly our young people, in building a strong, cohesive Nation Brand. These activities, together with engagements at provincial level on Nation Brand alignment, contribute to social cohesion and a positive Nation Brand.
Brand South Africa’s activities took place under the leadership of its new CEO, Amb. Kingsley Makhubela, PhD, who joined the organisation during the year.

Create successful ePaper yourself
Turn your PDF publications into a flip-book with our unique Google optimized e-Paper software.
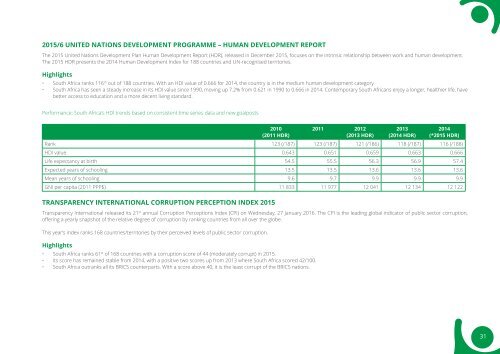
<strong>2015</strong>/6 United Nations Development Programme – Human Development Report<br />
The <strong>2015</strong> United Nations Development Plan Human Development Report (HDR), released in December <strong>2015</strong>, focuses on the intrinsic relationship between work and human development.<br />
The <strong>2015</strong> HDR presents the 2014 Human Development Index for 188 countries and UN-recognised territories.<br />
Highlights<br />
• <strong>South</strong> <strong>Africa</strong> ranks 116 th out of 188 countries. With an HDI value of 0.666 for 2014, the country is in the medium human development category.<br />
• <strong>South</strong> <strong>Africa</strong> has seen a steady increase in its HDI value since 1990, moving up 7.2% from 0.621 in 1990 to 0.666 in 2014. Contemporary <strong>South</strong> <strong>Africa</strong>ns enjoy a longer, healthier life, have<br />
better access to education and a more decent living standard.<br />
Performance: <strong>South</strong> <strong>Africa</strong>’s HDI trends based on consistent time series data and new goalposts<br />
Transparency International Corruption Perception Index <strong>2015</strong><br />
Transparency International released its 21 st annual Corruption Perceptions Index (CPI) on Wednesday, 27 January <strong>2016</strong>. The CPI is the leading global indicator of public sector corruption,<br />
offering a yearly snapshot of the relative degree of corruption by ranking countries from all over the globe.<br />
This year’s index ranks 168 countries/territories by their perceived levels of public sector corruption.<br />
2010<br />
(2011 HDR)<br />
Highlights<br />
• <strong>South</strong> <strong>Africa</strong> ranks 61 st of 168 countries with a corruption score of 44 (moderately corrupt) in <strong>2015</strong>.<br />
• Its score has remained stable from 2014, with a positive two scores up from 2013 where <strong>South</strong> <strong>Africa</strong> scored 42/100.<br />
• <strong>South</strong> <strong>Africa</strong> outranks all its BRICS counterparts. With a score above 40, it is the least corrupt of the BRICS nations.<br />
2011 2012<br />
(2013 HDR)<br />
2013<br />
(2014 HDR)<br />
2014<br />
(*<strong>2015</strong> HDR)<br />
Rank 123 (/187) 123 (/187) 121 (/186) 118 (/187) 116 (/188)<br />
HDI value 0.643 0.651 0.659 0.663 0.666<br />
Life expectancy at birth 54.5 55.5 56.3 56.9 57.4<br />
Expected years of schooling 13.5 13.5 13.6 13.6 13.6<br />
Mean years of schooling 9.6 9.7 9.9 9.9 9.9<br />
GNI per capita (2011 PPP$) 11 833 11 977 12 041 12 134 12 122<br />
31