- Page 1 and 2:
Voluntary Children’s Chemical Eva
- Page 3 and 4:
6.1.2 Types of Adverse Health Effec
- Page 5 and 6:
Glossary of Terms μg Microgram AA
- Page 7 and 8:
STEL Short-Term Exposure Limit TEAM
- Page 9 and 10:
enzene induced pancytopenias can pr
- Page 11 and 12:
A fertility study in female rats ex
- Page 13 and 14:
estimate is very conservative both
- Page 15 and 16:
2.0 BASIS FOR INCLUSION OF BENZENE
- Page 17 and 18:
2.5 Air Monitoring Data Several of
- Page 19 and 20:
Table 3.1: Proposed Benzene AEGL Va
- Page 21 and 22:
4.0 Regulatory Overview This sectio
- Page 23 and 24:
passenger vehicles operated at cold
- Page 25 and 26:
Benzene has been designated a hazar
- Page 27 and 28:
products had ceased” [46 Fed. Reg
- Page 29 and 30:
5.0 CHEMICAL OVERVIEW This section
- Page 31 and 32:
Table 5.3: Environmental Fate and T
- Page 33 and 34:
general, the production rate is abo
- Page 35 and 36:
gasoline. Aromatic hydrocarbons, su
- Page 37 and 38:
The EPA Office of Air Quality Plann
- Page 39 and 40:
Benzene VCCEP Submission March 2006
- Page 41 and 42:
Table 5.11: Benzene Releases for Al
- Page 43 and 44:
6.1.2.2 Chronic Toxicity Toxicity a
- Page 45 and 46:
6.1.2.2e Other Hematopoietic Malign
- Page 47 and 48:
that transient, high peak exposures
- Page 49 and 50:
absorption compared to inhalation,
- Page 51 and 52:
increased risk of disease. It shoul
- Page 53 and 54:
The National Cancer Institute (NCI)
- Page 55 and 56:
exposure. This was also supported b
- Page 57 and 58:
follow-up of this same cohort, Wong
- Page 59 and 60:
development of MDS)and/or AML. It i
- Page 61 and 62:
quantification of benzene air conce
- Page 63 and 64:
4.0, 95% CI = 1.8-9.3) but not ALL
- Page 65 and 66:
6.2 Benzene Toxicology—Animal Haz
- Page 67 and 68:
eakage and loss was comparable whet
- Page 69 and 70:
Benzene VCCEP Submission March 2006
- Page 71 and 72:
Table 6.2: In Vivo Genotoxicity of
- Page 73 and 74:
Table 6.2 Continued: In Vivo Genoto
- Page 75 and 76:
6.2.2.3 Transplacental Genotoxicity
- Page 77 and 78:
induce solid tumors in animals in t
- Page 79 and 80:
mice in the 300-ppm group had bilat
- Page 81 and 82:
decreases in maternal weight gain,
- Page 83 and 84:
Benzene VCCEP Submission March 2006
- Page 85 and 86:
Benzene VCCEP Submission March 2006
- Page 87 and 88:
increased resorptions. The effects
- Page 89 and 90: proposed that transplacental effect
- Page 91 and 92: glycerol lysis time, and incidence
- Page 93 and 94: 6.2.5.2 Chronic Toxicity Repeat-dos
- Page 95 and 96: LOAELs for carcinogenic effects in
- Page 97 and 98: the measurements of doses are suspe
- Page 99 and 100: intracellular pathogen, Listeria mo
- Page 101 and 102: 2. Evidence indicates that myelotox
- Page 103 and 104: 7.0 Exposure Assessments This secti
- Page 105 and 106: throughout childhood, see Table 7.1
- Page 107 and 108: 7.2 Sources of Benzene Exposure Chi
- Page 109 and 110: Table 7.3: Outdoor Ambient Air Benz
- Page 111 and 112: Table 7.5: County-Wide 24-hour Ambi
- Page 113 and 114: Age-specific benzene intakes are pr
- Page 115 and 116: Table 7.9: Total ADDs for Exposure
- Page 117 and 118: Table 7.10 (cont.) Study Location a
- Page 119 and 120: Table 7.11: Summary of Benzene Meas
- Page 121 and 122: factor change attributable to benze
- Page 123 and 124: where: ADD = average daily dose (mg
- Page 125 and 126: Table 7.16: Total ADDS from In-Home
- Page 127 and 128: Table 7.18: Summary of Age-Specific
- Page 129 and 130: Table 7.20: Summary Statistics for
- Page 131 and 132: Benzene VCCEP Submission March 2006
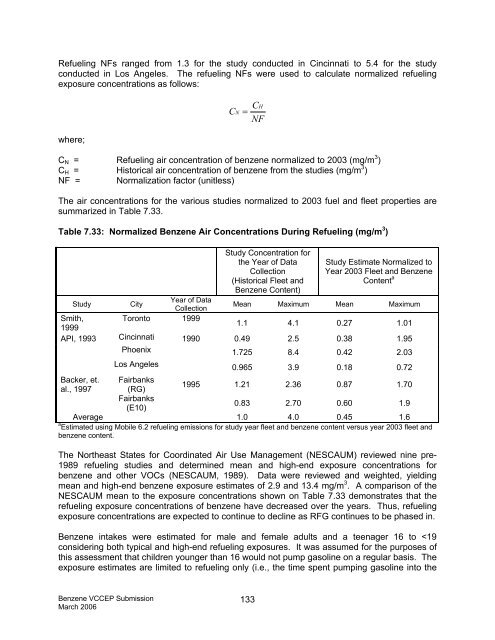
- Page 133 and 134: Benzene VCCEP Submission March 2006
- Page 135 and 136: In-Vehicle Exposures In-vehicle exp
- Page 137 and 138: Table 7.30: Average of Mean In-Vehi
- Page 139: e similar to those in other U.S. st
- Page 143 and 144: use of small non-road engine equipm
- Page 145 and 146: Children may be exposed to benzene
- Page 147 and 148: Table 7.36: Typical School Year Wee
- Page 149 and 150: An addition of less than 1 µg/m 3
- Page 151 and 152: In the mid-1990s, the American Petr
- Page 153 and 154: Table 7.44: Dermal Benzene Absorpti
- Page 155 and 156: Table 7.47: Product Names and Manuf
- Page 157 and 158: Table 7.49: Summary of Age-Specific
- Page 159 and 160: For children and non-smoking adults
- Page 161 and 162: Benzene Exposure (mg/kg-day) Figure
- Page 163 and 164: ackground pathways of exposure, inc
- Page 165 and 166: 8.1.3 EPA Default Risk Assessment N
- Page 167 and 168: 8.2.1 Potential for Increased Sensi
- Page 169 and 170: These findings illustrate examples
- Page 171 and 172: information associated with benzene
- Page 173 and 174: species are more sensitive than oth
- Page 175 and 176: 8.2.3.1 Point of Departure for Non-
- Page 177 and 178: Cancer risks were calculated using
- Page 179 and 180: NONCANCER HAZARD QUOTIENT 1.00 0.09
- Page 181 and 182: Table 8.1. Derivation of noncancer
- Page 183 and 184: Table 8.3. Points of departure for
- Page 185 and 186: Table 8.4. (cont.) Noncancer Hazard
- Page 187 and 188: Table 8.5. Noncancer hazard quotien
- Page 189 and 190: Table 8.6. Cancer risk estimates as
- Page 191 and 192:
Table 8.7. Indoor air comparison (i
- Page 193 and 194:
Table 8.9. Noncancer margins of saf
- Page 195 and 196:
Table 8.10. Noncancer margins of sa
- Page 197 and 198:
Table 8.11. Indoor air comparison (
- Page 199 and 200:
Table 8.13. (cont.) Notes: Cancer M
- Page 201 and 202:
the continental U.S. for each leuke
- Page 203 and 204:
in significant reductions in benzen
- Page 205 and 206:
Aksoy M (1977) Leukemia in workers
- Page 207 and 208:
Austin, C.C., Wang, D., Ecobichon,
- Page 209 and 210:
Buckley, J.D., Ribison, L.L., Swoti
- Page 211 and 212:
CONCAWE. 1996. Scientific basis for
- Page 213 and 214:
Ding, X-J, Li, Y., Ding, Y. el al.
- Page 215 and 216:
Forni, A. 1994. Comparison of chrom
- Page 217 and 218:
Goldwater LJ (1941) Disturbances in
- Page 219 and 220:
Hsieh, G.C., Parker, R.D., and Shar
- Page 221 and 222:
Jo, W.K. and Park, K.H. 1998. Expos
- Page 223 and 224:
Lange, A., Smolik, R., Zatonski, W.
- Page 225 and 226:
Lynge E, Andersen A, Nilsson R, Bar
- Page 227 and 228:
Meadows, A., Obringer, A. M. O., Ba
- Page 229 and 230:
Nedelcheva V, Gut I, Soucek P, Tich
- Page 231 and 232:
Picciani, D. 1979. Cytogenetic stud
- Page 233 and 234:
Ross D, Siegel D, Gibson NW, Pachec
- Page 235 and 236:
Sathiakumar, N., Delzell, E., Cole,
- Page 237 and 238:
Smith, M. T., Zhang, L. P., Wang, Y
- Page 239 and 240:
Thomas, K.W., Pellizzari, E.D., Cla
- Page 241 and 242:
United States Environmental Protect
- Page 243 and 244:
URS. 2002. Air Quality Trend in the
- Page 245 and 246:
Weisel, C.P. 2002. Assessing exposu
- Page 247 and 248:
Xing, S.G., Shi, X., Wu, Z.L., Chen