- Page 2:
Knowledge Management Systems
- Page 6:
Professor Dr. Ronald Maier Leopold-
- Page 10:
VI Preface for the Third Edition to
- Page 14:
VIII Preface for the First Edition
- Page 18:
X Contents 4.3.1 Overview and relat
- Page 22:
XII Contents 8.3.2 The DeLone/McLea
- Page 26:
XIV Contents 16 Summary and Critica
- Page 30:
2 A. Introduction ized as knowledge
- Page 34:
4 A. Introduction of international
- Page 38:
6 A. Introduction organization, vis
- Page 42:
8 A. Introduction Examples show the
- Page 46:
10 A. Introduction Economics: How c
- Page 50:
12 A. Introduction Information Syst
- Page 54:
14 A. Introduction assets and type
- Page 58:
16 A. Introduction cal study are pr
- Page 62:
PART B Concepts and Theories Part B
- Page 66:
4 Foundation 4. Foundation 21 Recen
- Page 70:
4. Foundation 23 Within these disci
- Page 74:
4. Foundation 25 ceived limitations
- Page 78:
4. Foundation 27 in general and—i
- Page 82:
4. Foundation 29 barriers, for gene
- Page 86:
4. Foundation 31 Due to the importa
- Page 90:
4. Foundation 33 same area (Shimmin
- Page 94:
TABLE B-1. Summary of research fiel
- Page 98:
4. Foundation 37 pretation of knowl
- Page 102:
4. Foundation 39 nizational learnin
- Page 106:
4. Foundation 41 Step 1: data base
- Page 110:
4. Foundation 43 then made physical
- Page 114:
4. Foundation 45 Hypothesis 3: Know
- Page 118:
4. Foundation 47 ICT: requires a s
- Page 122:
4. Foundation 49 which is to develo
- Page 126:
4. Foundation 51 Coordination in tr
- Page 130:
4. Foundation 53 the integration of
- Page 134:
4. Foundation 55 Example: Knowledge
- Page 138:
4. Foundation 57 Objects. Depending
- Page 142:
4. Foundation 59 Konno 1998, 40, 53
- Page 146:
4. Foundation 61 observation, opini
- Page 150:
4. Foundation 63 one of the philoso
- Page 154:
4. Foundation 65 knowledge is the b
- Page 158:
4. Foundation 67 informal support:
- Page 162:
TABLE B-3. Classifications of knowl
- Page 166:
4. Foundation 71 through joint obse
- Page 170:
4. Foundation 73 tion’s Intranet)
- Page 174:
4. Foundation 75 tive) and whether
- Page 178:
4. Foundation 77 dimension of knowl
- Page 182:
4. Foundation 79 tion’s Intranet
- Page 186:
4. Foundation 81 organizational pro
- Page 190:
4. Foundation 83 Some of these term
- Page 194:
4. Foundation 85 agement systems wi
- Page 198:
4. Foundation 87 The main differenc
- Page 202:
4. Foundation 89 people-finder syst
- Page 206:
4. Foundation 91 tive, these are se
- Page 210:
5 Strategy 5. Strategy 93 Consideri
- Page 214:
5. Strategy 95 sively pays attentio
- Page 218:
5. Strategy 97 a superior use of th
- Page 222:
organization-specific resources int
- Page 226:
5. Strategy 101 tion with other org
- Page 230:
5. Strategy 103 However, both the r
- Page 234:
5. Strategy 105 but knowledge diffe
- Page 238:
5. Strategy 107 nent process of int
- Page 242:
5. Strategy 109 1990, Leonard-Barto
- Page 246:
5. Strategy 111 Scenario 1. If an o
- Page 250:
5. Strategy 113 the field of active
- Page 254:
5. Strategy 115 manage knowledge a
- Page 258:
5. Strategy 117 retirement or other
- Page 262:
5. Strategy 119 the process of goa
- Page 266:
5. Strategy 121 Research and develo
- Page 270:
5. Strategy 123 Technological—org
- Page 274:
5. Strategy 125 Organizational scop
- Page 278:
5. Strategy 127 Customer-focused kn
- Page 282:
5. Strategy 129 5.2.3 Generic knowl
- Page 286:
5. Strategy 131 A comparison of the
- Page 290:
5. Strategy 133 Clear economic bene
- Page 294:
TABLE B-6. Importance of success fa
- Page 298:
5. Strategy 137 This section define
- Page 302:
5. Strategy 139 This definition str
- Page 306:
5. Strategy 141 Assessment. Identif
- Page 310:
5. Strategy 143 i.e. acquisition, a
- Page 314:
5. Strategy 145 ners’ knowledge b
- Page 318:
5. Strategy 147 ing. Next to the us
- Page 322:
5. Strategy 149 Knowledge diffusion
- Page 326:
5. Strategy 151 such as goals, task
- Page 330:
6 Organization 6. Organization 153
- Page 334:
6. Organization 155 to show that, a
- Page 338:
6. Organization 157 These three con
- Page 342:
6. Organization 159 requiring the d
- Page 346:
6. Organization 161 KTD - Knowledge
- Page 350:
6. Organization 163 sponsor and kno
- Page 354:
6. Organization 165 Staples 2003, 3
- Page 358:
6. Organization 167 al. 1998, 363)
- Page 362:
6. Organization 169 can cross-post
- Page 366:
6. Organization 171 1998, 21). As o
- Page 370:
6. Organization 173 perspective wit
- Page 374:
6. Organization 175 to improve the
- Page 378:
6. Organization 177 theme-oriented
- Page 382:
6. Organization 179 in order to ove
- Page 386:
6. Organization 181 strategic comm
- Page 390:
6. Organization 183 where people re
- Page 394:
TABLE B-9. Dimensions of communitie
- Page 398:
6. Organization 187 However, wherea
- Page 402:
6. Organization 189 Efficient instr
- Page 406:
6. Organization 191 and decision ma
- Page 410:
6. Organization 193 Trustful organi
- Page 414:
6. Organization 195 To sum up, it w
- Page 418:
TABLE B-11. Proposed instruments an
- Page 422:
6. Organization 199 knowledge in a
- Page 426:
6. Organization 201 sary for acrony
- Page 430:
6. Organization 203 learned instrum
- Page 434:
6. Organization 205 24 hours. Respo
- Page 438:
6. Organization 207 the ones used t
- Page 442:
6. Organization 209 The first categ
- Page 446:
6. Organization 211 Knowledge appli
- Page 450:
6. Organization 213 cess is a poten
- Page 454:
6. Organization 215 The knowledge p
- Page 458:
6. Organization 217 bined assignmen
- Page 462:
6. Organization 219 The continuous
- Page 466:
6. Organization 221 ment, human res
- Page 470:
6. Organization 223 Cultural change
- Page 474:
6. Organization 225 2. Family cultu
- Page 478:
6. Organization 227 The compromise
- Page 482:
6. Organization 229 ficient social
- Page 486:
6. Organization 231 needed (see Hil
- Page 490:
6. Organization 233 training of emp
- Page 494:
6. Organization 235 they will be wo
- Page 498:
6. Organization 237 During the pilo
- Page 502:
6. Organization 239 provide occasio
- Page 506:
6. Organization 241 ment business p
- Page 510:
6. Organization 243 ization, extern
- Page 514:
6. Organization 245 edge browser. T
- Page 518:
6. Organization 247 els a portion o
- Page 522:
production planner plan work order
- Page 526:
6. Organization 251 to-many relatio
- Page 530:
6. Organization 253 Business proces
- Page 534:
6. Organization 255 defined sequenc
- Page 538:
6. Organization 257 gest to documen
- Page 542:
6. Organization 259 machine-readabl
- Page 546:
6. Organization 261 ontology is bro
- Page 550:
6. Organization 263 implicit by ob
- Page 554:
6. Organization 265 holds basic kno
- Page 558:
6. Organization 267 Students have a
- Page 562:
6. Organization 269 1. Potential fo
- Page 566:
6. Organization 271 subject matter
- Page 570:
7 Systems 7. Systems 273 KMS were d
- Page 574:
7. Systems 275 cess of imaging whic
- Page 578:
7. Systems 277 use with business in
- Page 582:
7. Systems 279 have found their way
- Page 586:
7. Systems 281 and classify documen
- Page 590:
7. Systems 283 classification acco
- Page 594:
7. Systems 285 organize individual
- Page 598:
7. Systems 287 a contribution to a
- Page 602:
7. Systems 289 communities. The cho
- Page 606:
7. Systems 291 Knowledge thus can b
- Page 610:
7. Systems 293 knowledge. These inf
- Page 614:
7. Systems 295 Figure B-50 reviews
- Page 618:
7. Systems 297 Also, organizations
- Page 622:
7. Systems 299 The structure and or
- Page 626:
7. Systems 301 functions and layers
- Page 630:
7. Systems 303 see also (Alonso 200
- Page 634:
7. Systems 305 (Puschmann/Alt 2005)
- Page 638:
7. Systems 307 functions. Events sp
- Page 642:
7. Systems 309 vices to actual, “
- Page 646:
7. Systems 311 which comprise a pro
- Page 650:
7. Systems 313 integrative knowled
- Page 654:
Real-time News Feeds Corporate Docu
- Page 658:
7. Systems 317 architectures manife
- Page 662:
7. Systems 319 to the services orga
- Page 666:
7. Systems 321 needed to manage met
- Page 670:
7. Systems 323 ments or persons. Th
- Page 674:
7. Systems 325 (citation score), or
- Page 678:
2. Knowledge organization: 7. Syste
- Page 682:
7. Systems 329 newsgroups 530 which
- Page 686:
7. Systems 331 used simultaneously
- Page 690:
7. Systems 333 7.4.7 Personalizatio
- Page 694:
7. Systems 335 services in the KMS
- Page 698:
discovery full text search, reports
- Page 702:
7. Systems 339 can only be accessed
- Page 706:
7. Systems 341 on co-authoring and
- Page 710:
7. Systems 343 solid gray lines. Th
- Page 714:
7. Systems 345 ture, taxonomy and r
- Page 718:
7. Systems 347 edge that a subject
- Page 722:
7. Systems 349 7.5.3 Example: Infot
- Page 726:
7. Systems 351 location: any geogr
- Page 730:
7. Systems 353 Multi-dimensional vi
- Page 734:
7. Systems 355 information attached
- Page 738:
7. Systems 357 in documents that ty
- Page 742:
7. Systems 359 within organizationa
- Page 746:
7. Systems 361 project staffing or
- Page 750:
classifications on the basis of def
- Page 754:
Zack (1999a, 50), distinguishes sys
- Page 758:
In the Competence Center Business K
- Page 762:
7. Systems 369 ICT platforms. Corpo
- Page 766:
7. Systems 371 e.g., organizational
- Page 770:
7. Systems 373 asset management as
- Page 774:
7. Systems 375 have to be semantica
- Page 778:
7. Systems 377 against. The XML Sch
- Page 782:
7. Systems 379 assertion starting f
- Page 786:
7. Systems 381 MPEG-7 is a standard
- Page 790:
7. Systems 383 structured sequence
- Page 794:
7. Systems 385 ferred due to their
- Page 798:
7. Systems 387 ontology management
- Page 802:
7. Systems 389 riences with this ph
- Page 806:
7. Systems 391 can be stored using
- Page 810:
7. Systems 393 Knowledge interactio
- Page 814:
8 Economics 8. Economics 395 The de
- Page 818:
8. Economics 397 to measure intelle
- Page 822:
8. Economics 399 Software. In this
- Page 826:
8. Economics 401 the Balanced Scor
- Page 830:
8. Economics 403 measurement is sel
- Page 834:
8. Economics 405 The technical leve
- Page 838:
8. Economics 407 of the six categor
- Page 842:
8. Economics 409 contrary to the re
- Page 846:
8. Economics 411 Moreover, communic
- Page 850:
8. Economics 413 8.4.1 System quali
- Page 854:
8. Economics 415 project, an import
- Page 858:
8. Economics 417 In the case of int
- Page 862:
8. Economics 419 (type of) contents
- Page 866:
8. Economics 421 In the case of int
- Page 870:
8. Economics 423 knowledge can be a
- Page 874:
8. Economics 425 cially in communit
- Page 878:
8. Economics 427 companies have alr
- Page 882:
8. Economics 429 Rate of participat
- Page 886:
8. Economics 431 Centralization and
- Page 890:
8. Economics 433 Telephone and dire
- Page 894:
9. Summary and Critical Reflection
- Page 898:
PART C State of Practice Part C is
- Page 902:
10 Related Empirical Studies 10.1 S
- Page 906:
10. Related Empirical Studies 441 p
- Page 910:
10. Related Empirical Studies 443 1
- Page 914:
10. Related Empirical Studies 445 1
- Page 918:
10.2 Case studies 10. Related Empir
- Page 922:
10. Related Empirical Studies 449 S
- Page 926:
11. Research Design 451 The researc
- Page 930:
11.2 Methods, procedure and sample
- Page 934:
11. Research Design 455 Follow-up c
- Page 938:
11. Research Design 457 Hypothesis
- Page 942:
11. Research Design 459 Hypothesis
- Page 946:
11. Research Design 461 Hypothesis
- Page 950:
11. Research Design 463 In some cas
- Page 954:
11. Research Design 465 phase, wher
- Page 958:
11. Research Design 467 prove “co
- Page 962:
12. Strategy and Environment 469 ee
- Page 966:
12. Strategy and Environment 471 12
- Page 970:
12. Strategy and Environment 473 th
- Page 974:
12. Strategy and Environment 475 12
- Page 978:
12. Strategy and Environment 477 Th
- Page 982:
12. Strategy and Environment 479 th
- Page 986:
12. Strategy and Environment 481 So
- Page 990:
13. Organization 483 management (e.
- Page 994:
13. Organization 485 the number of
- Page 998:
13. Organization 487 employees. Tab
- Page 1002: 13. Organization 489 pares the aver
- Page 1006: 13. Organization 491 they used (21
- Page 1010: 13. Organization 493 26.9%). Six or
- Page 1014: 13. Organization 495 Thus, the rela
- Page 1018: 13. Organization 497 The FH Cologne
- Page 1022: 13. Organization 499 ing organizati
- Page 1026: 13. Organization 501 knowledge repo
- Page 1030: 13. Organization 503 The data point
- Page 1034: 13. Organization 505 Again, the dat
- Page 1038: 13. Organization 507 Also, organiza
- Page 1042: 13. Organization 509 whether his or
- Page 1046: 13. Organization 511 To sum up, the
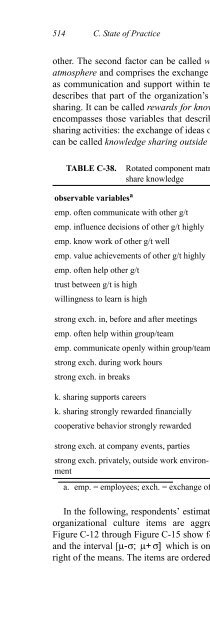
- Page 1050: 13. Organization 513 however, state
- Page 1056: 516 C. State of Practice high” in
- Page 1060: 518 C. State of Practice days organ
- Page 1064: 520 C. State of Practice and/or KMS
- Page 1068: 522 C. State of Practice place outs
- Page 1072: 524 C. State of Practice 14 Systems
- Page 1076: 526 C. State of Practice In general
- Page 1080: 528 C. State of Practice an organiz
- Page 1084: 530 C. State of Practice tem, direc
- Page 1088: 532 C. State of Practice Organizat
- Page 1092: 534 C. State of Practice Berlin stu
- Page 1096: 536 C. State of Practice legally se
- Page 1100: 538 C. State of Practice minority o
- Page 1104:
540 C. State of Practice The knowle
- Page 1108:
542 C. State of Practice tematic KM
- Page 1112:
544 C. State of Practice media elem
- Page 1116:
546 C. State of Practice As difficu
- Page 1120:
548 C. State of Practice The sixtee
- Page 1124:
550 C. State of Practice The differ
- Page 1128:
552 C. State of Practice sponding K
- Page 1132:
554 C. State of Practice the organi
- Page 1136:
556 C. State of Practice the (integ
- Page 1140:
558 C. State of Practice 14.3.4 Ext
- Page 1144:
560 C. State of Practice avgorggKMS
- Page 1148:
562 C. State of Practice mated the
- Page 1152:
564 C. State of Practice 15 Economi
- Page 1156:
566 C. State of Practice The range
- Page 1160:
568 C. State of Practice 15.1.3 Ré
- Page 1164:
570 C. State of Practice improve cu
- Page 1168:
572 C. State of Practice size or ge
- Page 1172:
574 C. State of Practice pared with
- Page 1176:
576 C. State of Practice tions and
- Page 1180:
578 C. State of Practice A higher r
- Page 1184:
580 C. State of Practice Apart from
- Page 1188:
582 C. State of Practice TABLE C-55
- Page 1192:
584 C. State of Practice integrated
- Page 1196:
586 C. State of Practice of the pro
- Page 1200:
588 C. State of Practice the first
- Page 1204:
590 C. State of Practice 20.The org
- Page 1208:
592 D. Conclusion and Outlook 17 Sc
- Page 1212:
594 D. Conclusion and Outlook moder
- Page 1216:
596 D. Conclusion and Outlook The
- Page 1220:
598 D. Conclusion and Outlook Strat
- Page 1224:
600 D. Conclusion and Outlook TABLE
- Page 1228:
602 D. Conclusion and Outlook Strat
- Page 1232:
604 D. Conclusion and Outlook edge
- Page 1236:
606 D. Conclusion and Outlook exist
- Page 1240:
608 D. Conclusion and Outlook They
- Page 1244:
610 D. Conclusion and Outlook from
- Page 1248:
612 D. Conclusion and Outlook Addit
- Page 1252:
614 D. Conclusion and Outlook stren
- Page 1256:
616 D. Conclusion and Outlook the p
- Page 1260:
618 D. Conclusion and Outlook Conce
- Page 1264:
620 D. Conclusion and Outlook The n
- Page 1268:
622 D. Conclusion and Outlook acti
- Page 1272:
624 D. Conclusion and Outlook stanc
- Page 1276:
626 D. Conclusion and Outlook tions
- Page 1280:
628 D. Conclusion and Outlook syste
- Page 1284:
630 D. Conclusion and Outlook secur
- Page 1288:
632 List of Figures FIGURE B-20. Ch
- Page 1292:
634 List of Figures FIGURE C-8. Mod
- Page 1296:
636 List of Tables TABLE B-20. Exam
- Page 1300:
638 List of Tables TABLE C-54. Summ
- Page 1304:
640 Bibliography and On-line Resour
- Page 1308:
642 Bibliography and On-line Resour
- Page 1312:
644 Bibliography and On-line Resour
- Page 1316:
646 Bibliography and On-line Resour
- Page 1320:
648 Bibliography and On-line Resour
- Page 1324:
650 Bibliography and On-line Resour
- Page 1328:
652 Bibliography and On-line Resour
- Page 1332:
654 Bibliography and On-line Resour
- Page 1336:
656 Bibliography and On-line Resour
- Page 1340:
658 Bibliography and On-line Resour
- Page 1344:
660 Bibliography and On-line Resour
- Page 1348:
662 Bibliography and On-line Resour
- Page 1352:
664 Bibliography and On-line Resour
- Page 1356:
666 Bibliography and On-line Resour
- Page 1360:
668 Bibliography and On-line Resour
- Page 1364:
670 Bibliography and On-line Resour
- Page 1368:
672 Bibliography and On-line Resour
- Page 1372:
674 Bibliography and On-line Resour
- Page 1376:
676 Bibliography and On-line Resour
- Page 1380:
678 Bibliography and On-line Resour
- Page 1384:
680 Bibliography and On-line Resour
- Page 1388:
682 Bibliography and On-line Resour
- Page 1392:
684 Bibliography and On-line Resour
- Page 1396:
686 Bibliography and On-line Resour
- Page 1400:
688 Bibliography and On-line Resour
- Page 1404:
690 Bibliography and On-line Resour
- Page 1408:
692 Bibliography and On-line Resour
- Page 1412:
694 Bibliography and On-line Resour
- Page 1416:
696 Bibliography and On-line Resour
- Page 1420:
698 Bibliography and On-line Resour
- Page 1424:
700 Bibliography and On-line Resour
- Page 1428:
702 Bibliography and On-line Resour
- Page 1432:
704 Bibliography and On-line Resour
- Page 1436:
706 Bibliography and On-line Resour
- Page 1440:
708 Bibliography and On-line Resour
- Page 1444:
710 Bibliography and On-line Resour
- Page 1448:
Index A access services 320 acquisi
- Page 1452:
empiricism 62 encryption 377 end to
- Page 1456:
knowledge process redesign 112, 593
- Page 1460:
public relations 176 push-oriented