On the Flavor Problem in Strongly Coupled Theories - THEP Mainz
On the Flavor Problem in Strongly Coupled Theories - THEP Mainz
On the Flavor Problem in Strongly Coupled Theories - THEP Mainz

Create successful ePaper yourself
Turn your PDF publications into a flip-book with our unique Google optimized e-Paper software.
which are given by <strong>the</strong> overlap <strong>in</strong>tegrals<br />
(g A L )qi<br />
� 1 2π<br />
=<br />
Lɛ<br />
ɛ<br />
dt<br />
t χ(1)<br />
A<br />
�<br />
× tan θ a (Q)†<br />
i<br />
(g A � 1 2π dt<br />
R)qi =<br />
Lɛ ɛ t χ(1)<br />
A<br />
�<br />
×<br />
tan θ a (q)†<br />
i<br />
3.7. <strong>Flavor</strong> Observables and LHC Bounds 143<br />
C(Q)<br />
i (t) C (Q)<br />
i (t) a (Q)<br />
i<br />
C(q)<br />
i<br />
− cot θ a(q)†<br />
i<br />
S(q)<br />
i<br />
(3.118)<br />
�<br />
(t) S(q) (t) a(q) ,<br />
(3.119)<br />
(t) C(q)<br />
i (t) a(q)<br />
i − cot θ a(Q)†<br />
i S (Q)<br />
i (t) S (Q)<br />
i (t) a (Q)<br />
�<br />
i ,<br />
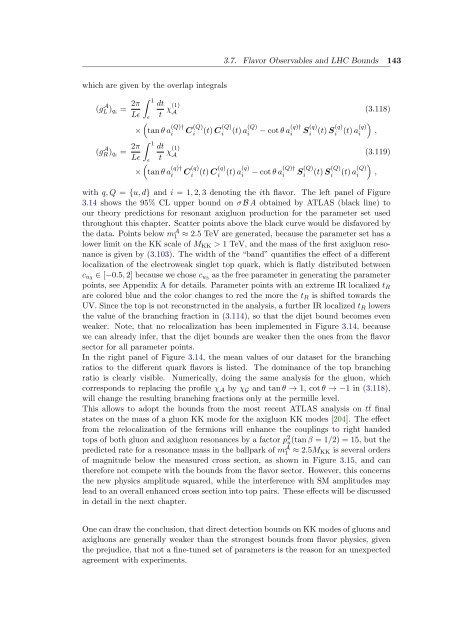
with q, Q = {u, d} and i = 1, 2, 3 denot<strong>in</strong>g <strong>the</strong> ith flavor. The left panel of Figure<br />
3.14 shows <strong>the</strong> 95% CL upper bound on σ B A obta<strong>in</strong>ed by ATLAS (black l<strong>in</strong>e) to<br />
our <strong>the</strong>ory predictions for resonant axigluon production for <strong>the</strong> parameter set used<br />
throughout this chapter. Scatter po<strong>in</strong>ts above <strong>the</strong> black curve would be disfavored by<br />
<strong>the</strong> data. Po<strong>in</strong>ts below mA 1 ≈ 2.5 TeV are generated, because <strong>the</strong> parameter set has a<br />
lower limit on <strong>the</strong> KK scale of MKK > 1 TeV, and <strong>the</strong> mass of <strong>the</strong> first axigluon resonance<br />
is given by (3.103). The width of <strong>the</strong> “band” quantifies <strong>the</strong> effect of a different<br />
localization of <strong>the</strong> electroweak s<strong>in</strong>glet top quark, which is flatly distributed between<br />
∈ [−0.5, 2] because we chose cu3 as <strong>the</strong> free parameter <strong>in</strong> generat<strong>in</strong>g <strong>the</strong> parameter<br />
cu3<br />
po<strong>in</strong>ts, see Appendix A for details. Parameter po<strong>in</strong>ts with an extreme IR localized tR<br />
are colored blue and <strong>the</strong> color changes to red <strong>the</strong> more <strong>the</strong> tR is shifted towards <strong>the</strong><br />
UV. S<strong>in</strong>ce <strong>the</strong> top is not reconstructed <strong>in</strong> <strong>the</strong> analysis, a fur<strong>the</strong>r IR localized tR lowers<br />
<strong>the</strong> value of <strong>the</strong> branch<strong>in</strong>g fraction <strong>in</strong> (3.114), so that <strong>the</strong> dijet bound becomes even<br />
weaker. Note, that no relocalization has been implemented <strong>in</strong> Figure 3.14, because<br />
we can already <strong>in</strong>fer, that <strong>the</strong> dijet bounds are weaker <strong>the</strong>n <strong>the</strong> ones from <strong>the</strong> flavor<br />
sector for all parameter po<strong>in</strong>ts.<br />
In <strong>the</strong> right panel of Figure 3.14, <strong>the</strong> mean values of our dataset for <strong>the</strong> branch<strong>in</strong>g<br />
ratios to <strong>the</strong> different quark flavors is listed. The dom<strong>in</strong>ance of <strong>the</strong> top branch<strong>in</strong>g<br />
ratio is clearly visible. Numerically, do<strong>in</strong>g <strong>the</strong> same analysis for <strong>the</strong> gluon, which<br />
corresponds to replac<strong>in</strong>g <strong>the</strong> profile χA by χG and tan θ → 1, cot θ → −1 <strong>in</strong> (3.118),<br />
will change <strong>the</strong> result<strong>in</strong>g branch<strong>in</strong>g fractions only at <strong>the</strong> permille level.<br />
This allows to adopt <strong>the</strong> bounds from <strong>the</strong> most recent ATLAS analysis on t¯t f<strong>in</strong>al<br />
states on <strong>the</strong> mass of a gluon KK mode for <strong>the</strong> axigluon KK modes [204]. The effect<br />
from <strong>the</strong> relocalization of <strong>the</strong> fermions will enhance <strong>the</strong> coupl<strong>in</strong>gs to right handed<br />
tops of both gluon and axigluon resonances by a factor p2 u(tan β = 1/2) = 15, but <strong>the</strong><br />
predicted rate for a resonance mass <strong>in</strong> <strong>the</strong> ballpark of mA 1 ≈ 2.5MKK is several orders<br />
of magnitude below <strong>the</strong> measured cross section, as shown <strong>in</strong> Figure 3.15, and can<br />
<strong>the</strong>refore not compete with <strong>the</strong> bounds from <strong>the</strong> flavor sector. However, this concerns<br />
<strong>the</strong> new physics amplitude squared, while <strong>the</strong> <strong>in</strong>terference with SM amplitudes may<br />
lead to an overall enhanced cross section <strong>in</strong>to top pairs. These effects will be discussed<br />
<strong>in</strong> detail <strong>in</strong> <strong>the</strong> next chapter.<br />
<strong>On</strong>e can draw <strong>the</strong> conclusion, that direct detection bounds on KK modes of gluons and<br />
axigluons are generally weaker than <strong>the</strong> strongest bounds from flavor physics, given<br />
<strong>the</strong> prejudice, that not a f<strong>in</strong>e-tuned set of parameters is <strong>the</strong> reason for an unexpected<br />
agreement with experiments.<br />
i<br />
i