On the Flavor Problem in Strongly Coupled Theories - THEP Mainz
On the Flavor Problem in Strongly Coupled Theories - THEP Mainz
On the Flavor Problem in Strongly Coupled Theories - THEP Mainz

You also want an ePaper? Increase the reach of your titles
YUMPU automatically turns print PDFs into web optimized ePapers that Google loves.
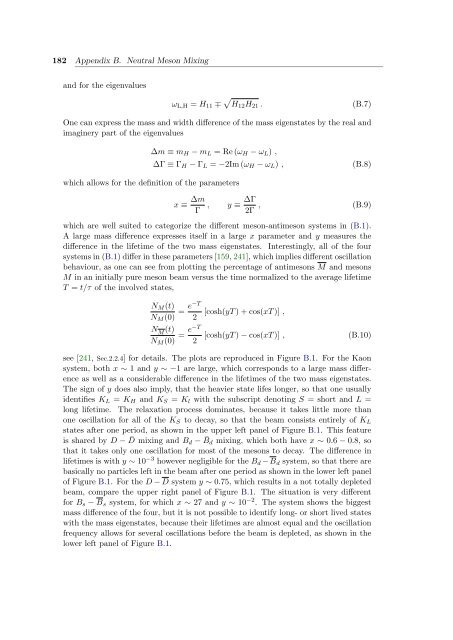
182 Appendix B. Neutral Meson Mix<strong>in</strong>g<br />
and for <strong>the</strong> eigenvalues<br />
ωL,H = H11 ∓ � H12H21 . (B.7)<br />
<strong>On</strong>e can express <strong>the</strong> mass and width difference of <strong>the</strong> mass eigenstates by <strong>the</strong> real and<br />
imag<strong>in</strong>ery part of <strong>the</strong> eigenvalues<br />
∆m ≡ mH − mL = Re (ωH − ωL) ,<br />
which allows for <strong>the</strong> def<strong>in</strong>ition of <strong>the</strong> parameters<br />
∆Γ ≡ ΓH − ΓL = −2Im (ωH − ωL) , (B.8)<br />
x ≡ ∆m<br />
Γ<br />
, y ≡ ∆Γ<br />
2Γ<br />
, (B.9)<br />
which are well suited to categorize <strong>the</strong> different meson-antimeson systems <strong>in</strong> (B.1).<br />
A large mass difference expresses itself <strong>in</strong> a large x parameter and y measures <strong>the</strong><br />
difference <strong>in</strong> <strong>the</strong> lifetime of <strong>the</strong> two mass eigenstates. Interest<strong>in</strong>gly, all of <strong>the</strong> four<br />
systems <strong>in</strong> (B.1) differ <strong>in</strong> <strong>the</strong>se parameters [159, 241], which implies different oscillation<br />
behaviour, as one can see from plott<strong>in</strong>g <strong>the</strong> percentage of antimesons M and mesons<br />
M <strong>in</strong> an <strong>in</strong>itially pure meson beam versus <strong>the</strong> time normalized to <strong>the</strong> average lifetime<br />
T = t/τ of <strong>the</strong> <strong>in</strong>volved states,<br />
NM(t) e−T<br />
=<br />
NM(0) 2<br />
NM (t) e−T<br />
=<br />
NM(0) 2<br />
[cosh(yT ) + cos(xT )] ,<br />
[cosh(yT ) − cos(xT )] , (B.10)<br />
see [241, Sec.2.2.4] for details. The plots are reproduced <strong>in</strong> Figure B.1. For <strong>the</strong> Kaon<br />
system, both x ∼ 1 and y ∼ −1 are large, which corresponds to a large mass difference<br />
as well as a considerable difference <strong>in</strong> <strong>the</strong> lifetimes of <strong>the</strong> two mass eigenstates.<br />
The sign of y does also imply, that <strong>the</strong> heavier state lifes longer, so that one usually<br />
identifies KL = KH and KS = Kl with <strong>the</strong> subscript denot<strong>in</strong>g S = short and L =<br />
long lifetime. The relaxation process dom<strong>in</strong>ates, because it takes little more than<br />
one oscillation for all of <strong>the</strong> KS to decay, so that <strong>the</strong> beam consists entirely of KL<br />
states after one period, as shown <strong>in</strong> <strong>the</strong> upper left panel of Figure B.1. This feature<br />
is shared by D − ¯ D mix<strong>in</strong>g and Bd − ¯ Bd mix<strong>in</strong>g, which both have x ∼ 0.6 − 0.8, so<br />
that it takes only one oscillation for most of <strong>the</strong> mesons to decay. The difference <strong>in</strong><br />
lifetimes is with y ∼ 10 −3 however negligible for <strong>the</strong> Bd − Bd system, so that <strong>the</strong>re are<br />
basically no particles left <strong>in</strong> <strong>the</strong> beam after one period as shown <strong>in</strong> <strong>the</strong> lower left panel<br />
of Figure B.1. For <strong>the</strong> D − D system y ∼ 0.75, which results <strong>in</strong> a not totally depleted<br />
beam, compare <strong>the</strong> upper right panel of Figure B.1. The situation is very different<br />
for Bs − Bs system, for which x ∼ 27 and y ∼ 10 −2 . The system shows <strong>the</strong> biggest<br />
mass difference of <strong>the</strong> four, but it is not possible to identify long- or short lived states<br />
with <strong>the</strong> mass eigenstates, because <strong>the</strong>ir lifetimes are almost equal and <strong>the</strong> oscillation<br />
frequency allows for several oscillations before <strong>the</strong> beam is depleted, as shown <strong>in</strong> <strong>the</strong><br />
lower left panel of Figure B.1.