- Page 1:
WIENER STÄDTISCHE Versicherung AG
- Page 4 and 5:
Stabilization measures. In connecti
- Page 6 and 7:
[THIS PAGE INTENTIONALLY LEFT BLANK
- Page 8 and 9:
Proceeding Regarding BA-CA Versiche
- Page 10 and 11:
[THIS PAGE INTENTIONALLY LEFT BLANK
- Page 12 and 13:
in detail factors which may influen
- Page 14 and 15:
“Benefia Non-Life” refers to BE
- Page 16 and 17:
“Unita” refers to Unita S.A. Vi
- Page 18 and 19:
Health insurance products are marke
- Page 20 and 21:
The Vienna Insurance Group can give
- Page 22 and 23:
The Offer Period and the Employee O
- Page 24 and 25:
Entitlement to Dividends: . . . . .
- Page 26 and 27:
RISK FACTORS Potential investors sh
- Page 28 and 29:
negative effects on the Vienna Insu
- Page 30 and 31:
safeguard the stability of the publ
- Page 32 and 33:
The Vienna Insurance Group depends
- Page 34 and 35:
Since the purchase price of the Tar
- Page 36 and 37:
always passed such resolutions as p
- Page 38 and 39:
General THE OFFERING The Offering c
- Page 40 and 41:
Global Coordinators on the basis of
- Page 42 and 43:
PLAN OF DISTRIBUTION Scope of and A
- Page 44 and 45:
Termination, Indemnification The Pu
- Page 46 and 47:
Japan The Offer Shares have not bee
- Page 48 and 49:
CAPITALIZATION The following table
- Page 50 and 51:
USE OF PROCEEDS Assuming all of the
- Page 52 and 53:
DIVIDEND POLICY All Existing Shares
- Page 54 and 55:
The respective country agreements i
- Page 56 and 57:
The table below sets forth key fina
- Page 58 and 59:
The table below sets forth key fina
- Page 60 and 61:
The table below sets forth key fina
- Page 62 and 63:
year, the Target Companies derived
- Page 64 and 65:
SELECTED FINANCIAL DATA The followi
- Page 66 and 67:
Vienna Insurance Group ranked secon
- Page 68 and 69:
Year Real economic growth Consumer
- Page 70 and 71:
therefore, good growth potential st
- Page 72 and 73:
Non-life rate-setting Rate-setting
- Page 74 and 75:
has also remained between 9.5 and 1
- Page 76 and 77:
Insurance policies generally includ
- Page 78 and 79:
Severance obligations Based on stat
- Page 80 and 81:
increase also came from insurance c
- Page 82 and 83:
of the scope of consolidation throu
- Page 84 and 85:
Financial result The following tabl
- Page 86 and 87:
The following table sets forth by r
- Page 88 and 89:
Health insurance segment The follow
- Page 90 and 91:
individual subsidiaries are respons
- Page 92 and 93:
Currently, neither the Management B
- Page 94 and 95:
EMBEDDED VALUE OF WIENER STÄDTISCH
- Page 96 and 97:
Group Embedded Value The following
- Page 98 and 99:
Overview BUSINESS With approximatel
- Page 100 and 101:
Life Insurance The life insurance b
- Page 102 and 103:
for a strong demand for these produ
- Page 104 and 105:
For more information regarding comp
- Page 106 and 107:
that entity. In 1938, “Gemeinde W
- Page 108 and 109:
In 2005, the Issuer acquired a part
- Page 110 and 111:
The following table sets forth the
- Page 112 and 113:
damages. The changes in the Vienna
- Page 114 and 115:
Corporate Customers In the property
- Page 116 and 117:
medical treatment, medicines (inclu
- Page 118 and 119:
In connection with endowment insura
- Page 120 and 121:
Wiener Städtische AG offers produc
- Page 122 and 123:
premiums written in fiscal year 200
- Page 124 and 125:
The Vienna Insurance Group conducts
- Page 126 and 127:
KOMUNÁLNA Poist’ovňa, a.s. Vien
- Page 128 and 129:
Description of the Six Most Importa
- Page 130 and 131:
The following table sets forth the
- Page 132 and 133:
11.8%), with premiums increasing by
- Page 134 and 135:
subsidiary of TBIH) transferred its
- Page 136 and 137:
The investment policy is more conse
- Page 138 and 139:
The following table sets forth the
- Page 140 and 141:
at equity). The table below provide
- Page 142 and 143:
ought against them will have a mate
- Page 144 and 145:
Trademarks and Patents The names
- Page 146 and 147:
Risk Management Organization The Gr
- Page 148 and 149:
Auditing In keeping with the minimu
- Page 150 and 151:
Reinsurers with a lower rating are
- Page 152 and 153:
Real Estate Risk The value of the r
- Page 154 and 155:
On the basis of the Group’s inter
- Page 156 and 157:
INSURANCE SUPERVISION Wiener Städt
- Page 158 and 159:
an ongoing basis. Insurance compani
- Page 160 and 161:
Persons that would like to directly
- Page 162 and 163:
In addition to his responsibilities
- Page 164 and 165:
Chairman of the supervisory board o
- Page 166 and 167:
Member of the supervisory board of
- Page 168 and 169:
General director (retired) KR Dr. K
- Page 170 and 171:
Members of the Extended Board The f
- Page 172 and 173:
Members of the Group Management Boa
- Page 174 and 175:
the extended Group board since 2008
- Page 176 and 177:
Member of management board, supervi
- Page 178 and 179:
Member of management board, supervi
- Page 180 and 181:
Member of management board, supervi
- Page 182 and 183:
Member of management board, supervi
- Page 184 and 185:
Shares and Stock Options Held by Me
- Page 186 and 187:
Human Resources Committee (committe
- Page 188 and 189:
DESCRIPTION OF SHARE CAPITAL AND SU
- Page 190 and 191:
through a resolution of the shareho
- Page 192 and 193:
After the capital increase resolved
- Page 194 and 195:
The following measures require purs
- Page 196 and 197:
Neither Austrian law nor the Articl
- Page 198 and 199:
Dividend Rights The offered New Sha
- Page 200 and 201:
the purchase price exceeds 10% of t
- Page 202 and 203:
The executive bodies of WST-Versich
- Page 204 and 205:
esolution on the formal approval of
- Page 206 and 207:
Taxation in Austria TAXATION Taxes
- Page 208 and 209: Capital Gains Resident Shareholders
- Page 210 and 211: tax consequences that may be releva
- Page 212 and 213: liability and may entitle such hold
- Page 214 and 215: THE VIENNA STOCK EXCHANGE The infor
- Page 216 and 217: Trading Volume In 2006, the aggrega
- Page 218 and 219: Czech languages. The dissemination
- Page 220 and 221: Takeover Commission and must prepar
- Page 222 and 223: THE PRAGUE STOCK EXCHANGE The follo
- Page 224 and 225: est quotation. During the closed ph
- Page 226 and 227: obligations; or (iv) a criminal off
- Page 228 and 229: Operating private hospitals in the
- Page 230 and 231: RESPONSIBILITY STATEMENT PURSUANT T
- Page 232 and 233: CONSOLIDATED BALANCE SHEET AS OF 31
- Page 234 and 235: CONSOLIDATED SHAREHOLDERS’ EQUITY
- Page 236 and 237: CONSOLIDATED CASH FLOW STATEMENT FR
- Page 238 and 239: SEGMENT REPORTING CONSOLIDATED INCO
- Page 240 and 241: total of 29 domestic and 41 foreign
- Page 242 and 243: In the third quarter, the Celetná
- Page 244 and 245: existing on the balance sheet repor
- Page 246 and 247: For both owner-occupied and third p
- Page 248 and 249: The credit quality of each contract
- Page 250 and 251: not set to zero for Group subsidiar
- Page 252 and 253: The calculations for 31 December 20
- Page 254 and 255: RISK REPORTING The Vienna Insurance
- Page 256 and 257: internal processes, strategic procu
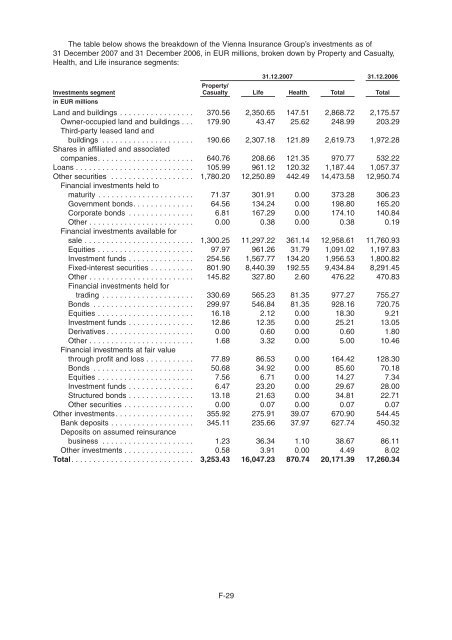
- Page 260 and 261: Other securities Financial investme
- Page 262 and 263: The following table shows Vienna In
- Page 264 and 265: measurement of the value of a compa
- Page 266 and 267: that occurred in the current and al
- Page 268 and 269: amount, the closely held corporatio
- Page 270 and 271: Unrealised profits and losses are a
- Page 272 and 273: Affiliated companies and participat
- Page 274 and 275: Affiliated companies and participat
- Page 276 and 277: Detail: Acquisition Costs Carried F
- Page 278 and 279: 9. RECEIVABLES Detail in EUR ’000
- Page 280 and 281: 13. CONSOLIDATED SHAREHOLDERS’ EQ
- Page 282 and 283: Development in EUR ’000 Property/
- Page 284 and 285: Development in life insurance 31.12
- Page 286 and 287: Development in severance obligation
- Page 288 and 289: 24. LIABILITIES Detail in EUR ’00
- Page 290 and 291: Off-balance sheet commitments The f
- Page 292 and 293: Premiums written — Direct life in
- Page 294 and 295: Detail — income in EUR ’000 Cur
- Page 296 and 297: Detail — expenses in EUR ’000 D
- Page 298 and 299: Detail in EUR ’000 Property/Casua
- Page 300 and 301: Detail in EUR ’000 Property/Casua
- Page 302 and 303: The Supervisory Board is composed o
- Page 304 and 305: the Austrian Stock Corporation Act
- Page 306 and 307: SIGNIFICANT EVENTS AFTER THE BALANC
- Page 308 and 309:
REPORT OF THE SUPERVISORY BOARD The
- Page 310 and 311:
INDEPENDENT AUDITOR’S REPORT We h
- Page 312 and 313:
CONSOLIDATED BALANCE SHEET AS OF 31
- Page 314 and 315:
CONSOLIDATED SHAREHOLDERS’ EQUITY
- Page 316 and 317:
CONSOLIDATED CASH FLOW STATEMENT FR
- Page 318 and 319:
SEGMENT REPORTING CONSOLIDATED INCO
- Page 320 and 321:
28 does not exist, since Wiener St
- Page 322 and 323:
Information on the companies that a
- Page 324 and 325:
Accounting policies for specific it
- Page 326 and 327:
Financial investments Financial inv
- Page 328 and 329:
Active tax deferrals are not recogn
- Page 330 and 331:
policyholders. These reserves are f
- Page 332 and 333:
Operating expenses Group personnel
- Page 334 and 335:
To manage these underwriting risks,
- Page 336 and 337:
The Vienna Insurance Group has made
- Page 338 and 339:
Investments segment Health Life in
- Page 340 and 341:
Equities As of 31 December 2006, Vi
- Page 342 and 343:
The following table shows the Vienn
- Page 344 and 345:
The shareholder margin is calculate
- Page 346 and 347:
Reinsurance The Vienna Insurance Gr
- Page 348 and 349:
Development of purchased insurance
- Page 350 and 351:
4. PARTICIPATIONS On 31 December 20
- Page 352 and 353:
Affiliated companies and participat
- Page 354 and 355:
The information required under § 2
- Page 356 and 357:
For financial investments available
- Page 358 and 359:
9. RECEIVABLES Detail in EUR ’000
- Page 360 and 361:
13. CONSOLIDATED SHAREHOLDERS’ EQ
- Page 362 and 363:
14. SUBORDINATED LIABILITIES Subord
- Page 364 and 365:
Health insurance mathematical reser
- Page 366 and 367:
Maturities in EUR ’000 31.12.2006
- Page 368 and 369:
23. OTHER PROVISIONS Detail in EUR
- Page 370 and 371:
agreements with other insurers conc
- Page 372 and 373:
income statement. A portion of the
- Page 374 and 375:
Detail — income in EUR ’000 Cur
- Page 376 and 377:
The Other income of EUR 7,091 milli
- Page 378 and 379:
33. OTHER EXPENSES Detail in EUR
- Page 380 and 381:
The Supervisory Board is comprised
- Page 382 and 383:
The Managing Board is comprised of
- Page 384 and 385:
Significant events after the balanc
- Page 386 and 387:
AUDITOR’S REPORT We have audited
- Page 388 and 389:
REPORT OF THE SUPERVISORY BOARD The
- Page 390 and 391:
CONSOLIDATED BALANCE SHEET AS OF 31
- Page 392 and 393:
CONSOLIDATED INCOME STATEMENT FOR T
- Page 394 and 395:
SEGMENT REPORTING CONSOLIDATED BALA
- Page 396 and 397:
NOTES TO THE CONSOLIDATED FINANCIAL
- Page 398 and 399:
During the reporting period from 1
- Page 400 and 401:
negative, taking into account capit
- Page 402 and 403:
factors including contract and mark
- Page 404 and 405:
The creditworthiness of each contra
- Page 406 and 407:
formed at the individual policy lev
- Page 408 and 409:
The reserves are recognised at the
- Page 410 and 411:
The other capital assets item consi
- Page 412 and 413:
date, real estate has not represent
- Page 414 and 415:
Embedded value sensitivity analysis
- Page 416 and 417:
IBNR provisions are formed to offse
- Page 418 and 419:
Private customer activities. Privat
- Page 420 and 421:
Detail in EUR ’000 31.12.2005 31.
- Page 422 and 423:
Affiliated companies and participat
- Page 424 and 425:
Affiliated companies and participat
- Page 426 and 427:
For financial instruments available
- Page 428 and 429:
10. CASH AND CASH EQUIVALENTS Detai
- Page 430 and 431:
existing preferred shares may be is
- Page 432 and 433:
17. RESERVE FOR OUTSTANDING CLAIMS
- Page 434 and 435:
22. OTHER PROVISIONS Detail in EUR
- Page 436 and 437:
Other threatened and pending court
- Page 438 and 439:
Premiums written, total account Pro
- Page 440 and 441:
29. OTHER INCOME Detail in EUR ’0
- Page 442 and 443:
Detail in EUR ’000 Property/Casua
- Page 444 and 445:
35. OTHER INFORMATION The Superviso
- Page 446 and 447:
The Management Board is comprised o
- Page 448 and 449:
in the area of pension funds in Bul
- Page 450 and 451:
Tax-free reserves In the consolidat
- Page 452 and 453:
AUDITOR’S REPORT We have audited
- Page 454 and 455:
Banker’s blanket bond The Banker
- Page 456 and 457:
Expense ratio The ratio of premium
- Page 458 and 459:
Loss ratio The percentage ratio of
- Page 460 and 461:
Shares of minority shareholders in
- Page 462 and 463:
experience are normal and are to be
- Page 464 and 465:
The FOG and the Cost of Non-Market
- Page 466 and 467:
The NBV has only been calculated fo
- Page 468 and 469:
policyholder behaviors, i.e. some a
- Page 470 and 471:
The yields shown are risk-free euro
- Page 472 and 473:
Sensitivity Analysis EEV The follow
- Page 474 and 475:
B&W Deloitte GmbH Magnusstra�e 11
- Page 476 and 477:
Embedded Value of the Target Compan
- Page 478 and 479:
3.2 Value of In-Force The VIF is th
- Page 480 and 481:
5. Sensitivity Analysis The followi
- Page 482 and 483:
[THIS PAGE INTENTIONALLY LEFT BLANK
- Page 484 and 485:
[THIS PAGE INTENTIONALLY LEFT BLANK
- Page 486 and 487:
ZUSAMMENFASSUNG DES PROSPEKTS Diese
- Page 488 and 489:
Gewinn vor Steuern von rund 1,05 Mr
- Page 490 and 491:
Sollten es die bisherigen Aktionär
- Page 492 and 493:
Mai 2008 ablaufen. Die Bezugsrechte
- Page 494 and 495:
diesem Prospekt enthaltenen Konzern
- Page 496 and 497:
SHRNUTÍ PROSPEKTU Toto shrnutí pr
- Page 498 and 499:
Dne 26. brˇezna 2008 uzavrˇely sp
- Page 500 and 501:
Uplatnění Upisovacích práv ze s
- Page 502 and 503:
prˇedstavují právo prˇevodu na
- Page 504 and 505:
Vybrané informativní finanční
- Page 506 and 507:
[THIS PAGE INTENTIONALLY LEFT BLANK