CONSOLIDATED CASH FLOW STATEMENT FROM 1 JANUARY 2006 TO DECEMBER 2006 in EUR ’000 2006 2005 Profit for the period less minority interest . . . . . . . . . . . . . . . . . . . . . . . . . 260,902 196,977 Minority interest . . . . . . . . . . . . . . . . . . . . . . . . . . . . . . . . . . . . . . . . . . . . 3,419 1,760 Profit for the period before minority interest .................... 264,321 198,737 Net change in other underwriting provisions . . . . . . . . . . . . . . . . . . . . . . . 1,837,184 1,597,345 Changes in other receivables and payables . . . . . . . . . . . . . . . . . . . . . . . �19,396 44,543 Changes in financial investments held for trading. . . . . . . . . . . . . . . . . . . �221,867 �219,691 Realised gains and losses of investments . . . . . . . . . . . . . . . . . . . . . . . . �162,304 �99,721 Write up/down of all other investments. . . . . . . . . . . . . . . . . . . . . . . . . . . 89,255 105,529 Changes in provisions for pension, post-employment benefits, and other personnel expenses . . . . . . . . . . . . . . . . . . . . . . . . . . . . . . . . . . . . . . . �64,776 �41,813 Changes in deferred tax assets/liabilities, excl. tax provisions . . . . . . . . . 25,059 �5,526 Changes in other balance sheet items . . . . . . . . . . . . . . . . . . . . . . . . . . . 2,214 19,554 Changes in goodwill and intangible assets . . . . . . . . . . . . . . . . . . . . . . . . �21,429 5,577 Other income and expenses affecting cash flow, and adjustments to net income for the period . . . . . . . . . . . . . . . . . . . . . . . . . . . . . . . . . . . . . . �82,903 �66,797 Cash Flow from operating activities ........................... 1,645,358 1,537,737 Cash proceeds from the sale of affiliated and associated companies . . . . 434 8,256 Payments for the acquisition of affiliated and associated companies . . . . �139,848 �283,239 Cash proceeds from the sale of other ownership interests . . . . . . . . . . . . 35,012 56,002 Payments for the acquisition of other ownership interests. . . . . . . . . . . . . �125,195 �31,746 Cash proceeds from the sale of available for sale securities. . . . . . . . . . . 2,905,305 2,548,784 Payments for the acquisition of available for sale securities . . . . . . . . . . . �4,169,853 �4,299,813 Cash proceeds from the sale of securities held to maturity . . . . . . . . . . . . 30,429 25,273 Payments for the acquisition of securities held to maturity . . . . . . . . . . . . �74,455 �52,366 Cash proceeds from the sale of land and buildings . . . . . . . . . . . . . . . . . 39,519 99,751 Payments for the acquisition of land and buildings . . . . . . . . . . . . . . . . . . �211,678 �62,479 Changes in unit- and index-linked life insurance items . . . . . . . . . . . . . . . �544,965 �463,126 Changes in other investments . . . . . . . . . . . . . . . . . . . . . . . . . . . . . . . . . 780,506 �155,149 Cash Flow from investing activities ........................... �1,474,789 �2,609,852 Capital increase. . . . . . . . . . . . . . . . . . . . . . . . . . . . . . . . . . . . . . . . . . . . — 904,383 Minority interest in capital increase . . . . . . . . . . . . . . . . . . . . . . . . . . . . . — 3,481 Increase in subordinated liabilities . . . . . . . . . . . . . . . . . . . . . . . . . . . . . . — 300,000 Dividend payments . . . . . . . . . . . . . . . . . . . . . . . . . . . . . . . . . . . . . . . . . �72,447 �42,863 Cash proceeds from and payments for other financing activities. . . . . . . . �174,870 �17,821 Cash Flow from financing activities ........................... �247,317 1,147,180 Net change in cash and cash eqivalents ....................... �76,748 75,065 Cash and cash equivalents at beginning of period ............... 290,347 193,421 Cash and cash equivalents at end of period .................... 226,443 290,347 Change in scope of consolidation ............................ 18,449 21,071 Foreign exchange differences in cash and cash equivalents ....... �5,605 844 Additional information interest and dividends received . . . . . . . . . . . . . . . . . . . . . . . . . . . . . . . . 626,423 559,474 interest paid. . . . . . . . . . . . . . . . . . . . . . . . . . . . . . . . . . . . . . . . . . . . . . . 81,531 56,515 F-86
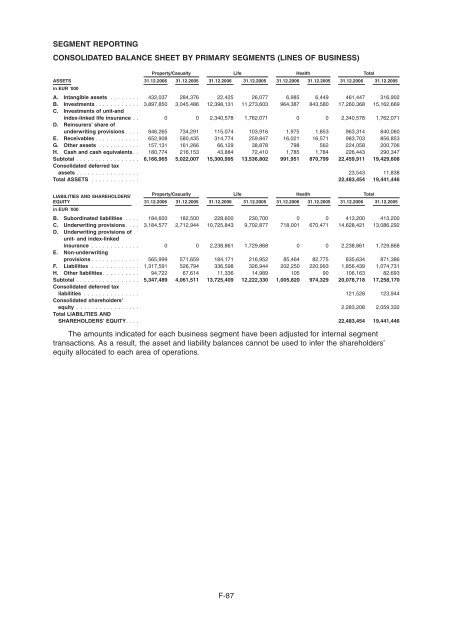
SEGMENT REPORTING CONSOLIDATED BALANCE SHEET BY PRIMARY SEGMENTS (LINES OF BUSINESS) Property/Casualty Life Health Total ASSETS 31.12.2006 31.12.2005 31.12.2006 31.12.2005 31.12.2006 31.12.2005 31.12.2006 31.12.2005 in EUR ’000 A. Intangible assets . . . . . . . . 432,037 284,376 22,425 26,077 6,985 6,449 461,447 316,902 B. Investments . . . . . . . . . . . . 3,897,850 3,045,486 12,398,131 11,273,603 964,387 843,580 17,260,368 15,162,669 C. Investments of unit-and index-linked life insurance . . 0 0 2,340,578 1,762,071 0 0 2,340,578 1,762,071 D. Reinsurers’ share of underwriting provisions . . . . 846,265 734,291 115,074 103,916 1,975 1,853 963,314 840,060 E. Receivables . . . . . . . . . . . . 652,908 580,435 314,774 259,847 16,021 16,571 983,703 856,853 G. Other assets . . . . . . . . . . . 157,131 161,266 66,129 38,878 798 562 224,058 200,706 H. Cash and cash equivalents . . 180,774 216,153 43,884 72,410 1,785 1,784 226,443 290,347 Subtotal ................. 6,166,965 5,022,007 15,300,995 13,536,802 991,951 870,799 22,459,911 19,429,608 Consolidated deferred tax assets ................. 23,543 11,838 Total ASSETS ............. 22,483,454 19,441,446 LIABILITIES AND SHAREHOLDERS’ Property/Casualty Life Health Total EQUITY 31.12.2006 31.12.2005 31.12.2006 31.12.2005 31.12.2006 31.12.2005 31.12.2006 31.12.2005 in EUR ’000 B. Subordinated liabilities . . . . 184,600 182,500 228,600 230,700 0 0 413,200 413,200 C. Underwriting provisions . . . . 3,184,577 2,712,944 10,725,843 9,702,877 718,001 670,471 14,628,421 13,086,292 D. Underwriting provisions of unit- and index-linked insurance . . . . . . . . . . . . . 0 0 2,238,861 1,729,868 0 0 2,238,861 1,729,868 E. Non-underwriting provisions . . . . . . . . . . . . . 565,999 571,659 184,171 216,952 85,464 82,775 835,634 871,386 F. Liabilities . . . . . . . . . . . . . 1,317,591 526,794 336,598 326,944 202,250 220,993 1,856,439 1,074,731 H. Other liabilities . . . . . . . . . . 94,722 67,614 11,336 14,989 105 90 106,163 82,693 Subtotal ................. 5,347,489 4,061,511 13,725,409 12,222,330 1,005,820 974,329 20,078,718 17,258,170 Consolidated deferred tax liabilities ............... 121,528 123,944 Consolidated shareholders’ equity ................. 2,283,208 2,059,332 Total LIABILITIES AND SHAREHOLDERS’ EQUITY. ... 22,483,454 19,441,446 The amounts indicated for each business segment have been adjusted for internal segment transactions. As a result, the asset and liability balances cannot be used to infer the shareholders’ equity allocated to each area of operations. F-87
- Page 1:
WIENER STÄDTISCHE Versicherung AG
- Page 4 and 5:
Stabilization measures. In connecti
- Page 6 and 7:
[THIS PAGE INTENTIONALLY LEFT BLANK
- Page 8 and 9:
Proceeding Regarding BA-CA Versiche
- Page 10 and 11:
[THIS PAGE INTENTIONALLY LEFT BLANK
- Page 12 and 13:
in detail factors which may influen
- Page 14 and 15:
“Benefia Non-Life” refers to BE
- Page 16 and 17:
“Unita” refers to Unita S.A. Vi
- Page 18 and 19:
Health insurance products are marke
- Page 20 and 21:
The Vienna Insurance Group can give
- Page 22 and 23:
The Offer Period and the Employee O
- Page 24 and 25:
Entitlement to Dividends: . . . . .
- Page 26 and 27:
RISK FACTORS Potential investors sh
- Page 28 and 29:
negative effects on the Vienna Insu
- Page 30 and 31:
safeguard the stability of the publ
- Page 32 and 33:
The Vienna Insurance Group depends
- Page 34 and 35:
Since the purchase price of the Tar
- Page 36 and 37:
always passed such resolutions as p
- Page 38 and 39:
General THE OFFERING The Offering c
- Page 40 and 41:
Global Coordinators on the basis of
- Page 42 and 43:
PLAN OF DISTRIBUTION Scope of and A
- Page 44 and 45:
Termination, Indemnification The Pu
- Page 46 and 47:
Japan The Offer Shares have not bee
- Page 48 and 49:
CAPITALIZATION The following table
- Page 50 and 51:
USE OF PROCEEDS Assuming all of the
- Page 52 and 53:
DIVIDEND POLICY All Existing Shares
- Page 54 and 55:
The respective country agreements i
- Page 56 and 57:
The table below sets forth key fina
- Page 58 and 59:
The table below sets forth key fina
- Page 60 and 61:
The table below sets forth key fina
- Page 62 and 63:
year, the Target Companies derived
- Page 64 and 65:
SELECTED FINANCIAL DATA The followi
- Page 66 and 67:
Vienna Insurance Group ranked secon
- Page 68 and 69:
Year Real economic growth Consumer
- Page 70 and 71:
therefore, good growth potential st
- Page 72 and 73:
Non-life rate-setting Rate-setting
- Page 74 and 75:
has also remained between 9.5 and 1
- Page 76 and 77:
Insurance policies generally includ
- Page 78 and 79:
Severance obligations Based on stat
- Page 80 and 81:
increase also came from insurance c
- Page 82 and 83:
of the scope of consolidation throu
- Page 84 and 85:
Financial result The following tabl
- Page 86 and 87:
The following table sets forth by r
- Page 88 and 89:
Health insurance segment The follow
- Page 90 and 91:
individual subsidiaries are respons
- Page 92 and 93:
Currently, neither the Management B
- Page 94 and 95:
EMBEDDED VALUE OF WIENER STÄDTISCH
- Page 96 and 97:
Group Embedded Value The following
- Page 98 and 99:
Overview BUSINESS With approximatel
- Page 100 and 101:
Life Insurance The life insurance b
- Page 102 and 103:
for a strong demand for these produ
- Page 104 and 105:
For more information regarding comp
- Page 106 and 107:
that entity. In 1938, “Gemeinde W
- Page 108 and 109:
In 2005, the Issuer acquired a part
- Page 110 and 111:
The following table sets forth the
- Page 112 and 113:
damages. The changes in the Vienna
- Page 114 and 115:
Corporate Customers In the property
- Page 116 and 117:
medical treatment, medicines (inclu
- Page 118 and 119:
In connection with endowment insura
- Page 120 and 121:
Wiener Städtische AG offers produc
- Page 122 and 123:
premiums written in fiscal year 200
- Page 124 and 125:
The Vienna Insurance Group conducts
- Page 126 and 127:
KOMUNÁLNA Poist’ovňa, a.s. Vien
- Page 128 and 129:
Description of the Six Most Importa
- Page 130 and 131:
The following table sets forth the
- Page 132 and 133:
11.8%), with premiums increasing by
- Page 134 and 135:
subsidiary of TBIH) transferred its
- Page 136 and 137:
The investment policy is more conse
- Page 138 and 139:
The following table sets forth the
- Page 140 and 141:
at equity). The table below provide
- Page 142 and 143:
ought against them will have a mate
- Page 144 and 145:
Trademarks and Patents The names
- Page 146 and 147:
Risk Management Organization The Gr
- Page 148 and 149:
Auditing In keeping with the minimu
- Page 150 and 151:
Reinsurers with a lower rating are
- Page 152 and 153:
Real Estate Risk The value of the r
- Page 154 and 155:
On the basis of the Group’s inter
- Page 156 and 157:
INSURANCE SUPERVISION Wiener Städt
- Page 158 and 159:
an ongoing basis. Insurance compani
- Page 160 and 161:
Persons that would like to directly
- Page 162 and 163:
In addition to his responsibilities
- Page 164 and 165:
Chairman of the supervisory board o
- Page 166 and 167:
Member of the supervisory board of
- Page 168 and 169:
General director (retired) KR Dr. K
- Page 170 and 171:
Members of the Extended Board The f
- Page 172 and 173:
Members of the Group Management Boa
- Page 174 and 175:
the extended Group board since 2008
- Page 176 and 177:
Member of management board, supervi
- Page 178 and 179:
Member of management board, supervi
- Page 180 and 181:
Member of management board, supervi
- Page 182 and 183:
Member of management board, supervi
- Page 184 and 185:
Shares and Stock Options Held by Me
- Page 186 and 187:
Human Resources Committee (committe
- Page 188 and 189:
DESCRIPTION OF SHARE CAPITAL AND SU
- Page 190 and 191:
through a resolution of the shareho
- Page 192 and 193:
After the capital increase resolved
- Page 194 and 195:
The following measures require purs
- Page 196 and 197:
Neither Austrian law nor the Articl
- Page 198 and 199:
Dividend Rights The offered New Sha
- Page 200 and 201:
the purchase price exceeds 10% of t
- Page 202 and 203:
The executive bodies of WST-Versich
- Page 204 and 205:
esolution on the formal approval of
- Page 206 and 207:
Taxation in Austria TAXATION Taxes
- Page 208 and 209:
Capital Gains Resident Shareholders
- Page 210 and 211:
tax consequences that may be releva
- Page 212 and 213:
liability and may entitle such hold
- Page 214 and 215:
THE VIENNA STOCK EXCHANGE The infor
- Page 216 and 217:
Trading Volume In 2006, the aggrega
- Page 218 and 219:
Czech languages. The dissemination
- Page 220 and 221:
Takeover Commission and must prepar
- Page 222 and 223:
THE PRAGUE STOCK EXCHANGE The follo
- Page 224 and 225:
est quotation. During the closed ph
- Page 226 and 227:
obligations; or (iv) a criminal off
- Page 228 and 229:
Operating private hospitals in the
- Page 230 and 231:
RESPONSIBILITY STATEMENT PURSUANT T
- Page 232 and 233:
CONSOLIDATED BALANCE SHEET AS OF 31
- Page 234 and 235:
CONSOLIDATED SHAREHOLDERS’ EQUITY
- Page 236 and 237:
CONSOLIDATED CASH FLOW STATEMENT FR
- Page 238 and 239:
SEGMENT REPORTING CONSOLIDATED INCO
- Page 240 and 241:
total of 29 domestic and 41 foreign
- Page 242 and 243:
In the third quarter, the Celetná
- Page 244 and 245:
existing on the balance sheet repor
- Page 246 and 247:
For both owner-occupied and third p
- Page 248 and 249:
The credit quality of each contract
- Page 250 and 251:
not set to zero for Group subsidiar
- Page 252 and 253:
The calculations for 31 December 20
- Page 254 and 255:
RISK REPORTING The Vienna Insurance
- Page 256 and 257:
internal processes, strategic procu
- Page 258 and 259:
Concentration risk Concentration ri
- Page 260 and 261:
Other securities Financial investme
- Page 262 and 263:
The following table shows Vienna In
- Page 264 and 265:
measurement of the value of a compa
- Page 266 and 267: that occurred in the current and al
- Page 268 and 269: amount, the closely held corporatio
- Page 270 and 271: Unrealised profits and losses are a
- Page 272 and 273: Affiliated companies and participat
- Page 274 and 275: Affiliated companies and participat
- Page 276 and 277: Detail: Acquisition Costs Carried F
- Page 278 and 279: 9. RECEIVABLES Detail in EUR ’000
- Page 280 and 281: 13. CONSOLIDATED SHAREHOLDERS’ EQ
- Page 282 and 283: Development in EUR ’000 Property/
- Page 284 and 285: Development in life insurance 31.12
- Page 286 and 287: Development in severance obligation
- Page 288 and 289: 24. LIABILITIES Detail in EUR ’00
- Page 290 and 291: Off-balance sheet commitments The f
- Page 292 and 293: Premiums written — Direct life in
- Page 294 and 295: Detail — income in EUR ’000 Cur
- Page 296 and 297: Detail — expenses in EUR ’000 D
- Page 298 and 299: Detail in EUR ’000 Property/Casua
- Page 300 and 301: Detail in EUR ’000 Property/Casua
- Page 302 and 303: The Supervisory Board is composed o
- Page 304 and 305: the Austrian Stock Corporation Act
- Page 306 and 307: SIGNIFICANT EVENTS AFTER THE BALANC
- Page 308 and 309: REPORT OF THE SUPERVISORY BOARD The
- Page 310 and 311: INDEPENDENT AUDITOR’S REPORT We h
- Page 312 and 313: CONSOLIDATED BALANCE SHEET AS OF 31
- Page 314 and 315: CONSOLIDATED SHAREHOLDERS’ EQUITY
- Page 318 and 319: SEGMENT REPORTING CONSOLIDATED INCO
- Page 320 and 321: 28 does not exist, since Wiener St
- Page 322 and 323: Information on the companies that a
- Page 324 and 325: Accounting policies for specific it
- Page 326 and 327: Financial investments Financial inv
- Page 328 and 329: Active tax deferrals are not recogn
- Page 330 and 331: policyholders. These reserves are f
- Page 332 and 333: Operating expenses Group personnel
- Page 334 and 335: To manage these underwriting risks,
- Page 336 and 337: The Vienna Insurance Group has made
- Page 338 and 339: Investments segment Health Life in
- Page 340 and 341: Equities As of 31 December 2006, Vi
- Page 342 and 343: The following table shows the Vienn
- Page 344 and 345: The shareholder margin is calculate
- Page 346 and 347: Reinsurance The Vienna Insurance Gr
- Page 348 and 349: Development of purchased insurance
- Page 350 and 351: 4. PARTICIPATIONS On 31 December 20
- Page 352 and 353: Affiliated companies and participat
- Page 354 and 355: The information required under § 2
- Page 356 and 357: For financial investments available
- Page 358 and 359: 9. RECEIVABLES Detail in EUR ’000
- Page 360 and 361: 13. CONSOLIDATED SHAREHOLDERS’ EQ
- Page 362 and 363: 14. SUBORDINATED LIABILITIES Subord
- Page 364 and 365: Health insurance mathematical reser
- Page 366 and 367:
Maturities in EUR ’000 31.12.2006
- Page 368 and 369:
23. OTHER PROVISIONS Detail in EUR
- Page 370 and 371:
agreements with other insurers conc
- Page 372 and 373:
income statement. A portion of the
- Page 374 and 375:
Detail — income in EUR ’000 Cur
- Page 376 and 377:
The Other income of EUR 7,091 milli
- Page 378 and 379:
33. OTHER EXPENSES Detail in EUR
- Page 380 and 381:
The Supervisory Board is comprised
- Page 382 and 383:
The Managing Board is comprised of
- Page 384 and 385:
Significant events after the balanc
- Page 386 and 387:
AUDITOR’S REPORT We have audited
- Page 388 and 389:
REPORT OF THE SUPERVISORY BOARD The
- Page 390 and 391:
CONSOLIDATED BALANCE SHEET AS OF 31
- Page 392 and 393:
CONSOLIDATED INCOME STATEMENT FOR T
- Page 394 and 395:
SEGMENT REPORTING CONSOLIDATED BALA
- Page 396 and 397:
NOTES TO THE CONSOLIDATED FINANCIAL
- Page 398 and 399:
During the reporting period from 1
- Page 400 and 401:
negative, taking into account capit
- Page 402 and 403:
factors including contract and mark
- Page 404 and 405:
The creditworthiness of each contra
- Page 406 and 407:
formed at the individual policy lev
- Page 408 and 409:
The reserves are recognised at the
- Page 410 and 411:
The other capital assets item consi
- Page 412 and 413:
date, real estate has not represent
- Page 414 and 415:
Embedded value sensitivity analysis
- Page 416 and 417:
IBNR provisions are formed to offse
- Page 418 and 419:
Private customer activities. Privat
- Page 420 and 421:
Detail in EUR ’000 31.12.2005 31.
- Page 422 and 423:
Affiliated companies and participat
- Page 424 and 425:
Affiliated companies and participat
- Page 426 and 427:
For financial instruments available
- Page 428 and 429:
10. CASH AND CASH EQUIVALENTS Detai
- Page 430 and 431:
existing preferred shares may be is
- Page 432 and 433:
17. RESERVE FOR OUTSTANDING CLAIMS
- Page 434 and 435:
22. OTHER PROVISIONS Detail in EUR
- Page 436 and 437:
Other threatened and pending court
- Page 438 and 439:
Premiums written, total account Pro
- Page 440 and 441:
29. OTHER INCOME Detail in EUR ’0
- Page 442 and 443:
Detail in EUR ’000 Property/Casua
- Page 444 and 445:
35. OTHER INFORMATION The Superviso
- Page 446 and 447:
The Management Board is comprised o
- Page 448 and 449:
in the area of pension funds in Bul
- Page 450 and 451:
Tax-free reserves In the consolidat
- Page 452 and 453:
AUDITOR’S REPORT We have audited
- Page 454 and 455:
Banker’s blanket bond The Banker
- Page 456 and 457:
Expense ratio The ratio of premium
- Page 458 and 459:
Loss ratio The percentage ratio of
- Page 460 and 461:
Shares of minority shareholders in
- Page 462 and 463:
experience are normal and are to be
- Page 464 and 465:
The FOG and the Cost of Non-Market
- Page 466 and 467:
The NBV has only been calculated fo
- Page 468 and 469:
policyholder behaviors, i.e. some a
- Page 470 and 471:
The yields shown are risk-free euro
- Page 472 and 473:
Sensitivity Analysis EEV The follow
- Page 474 and 475:
B&W Deloitte GmbH Magnusstra�e 11
- Page 476 and 477:
Embedded Value of the Target Compan
- Page 478 and 479:
3.2 Value of In-Force The VIF is th
- Page 480 and 481:
5. Sensitivity Analysis The followi
- Page 482 and 483:
[THIS PAGE INTENTIONALLY LEFT BLANK
- Page 484 and 485:
[THIS PAGE INTENTIONALLY LEFT BLANK
- Page 486 and 487:
ZUSAMMENFASSUNG DES PROSPEKTS Diese
- Page 488 and 489:
Gewinn vor Steuern von rund 1,05 Mr
- Page 490 and 491:
Sollten es die bisherigen Aktionär
- Page 492 and 493:
Mai 2008 ablaufen. Die Bezugsrechte
- Page 494 and 495:
diesem Prospekt enthaltenen Konzern
- Page 496 and 497:
SHRNUTÍ PROSPEKTU Toto shrnutí pr
- Page 498 and 499:
Dne 26. brˇezna 2008 uzavrˇely sp
- Page 500 and 501:
Uplatnění Upisovacích práv ze s
- Page 502 and 503:
prˇedstavují právo prˇevodu na
- Page 504 and 505:
Vybrané informativní finanční
- Page 506 and 507:
[THIS PAGE INTENTIONALLY LEFT BLANK