Erste Bank JPMorgan Merrill Lynch International
Erste Bank JPMorgan Merrill Lynch International
Erste Bank JPMorgan Merrill Lynch International

Create successful ePaper yourself
Turn your PDF publications into a flip-book with our unique Google optimized e-Paper software.
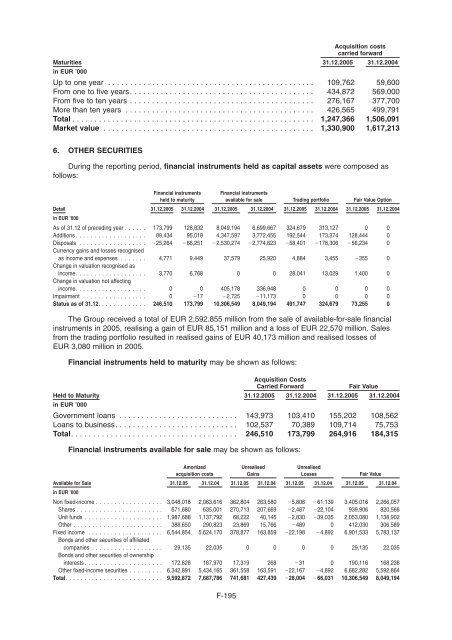
Acquisition costs<br />
carried forward<br />
Maturities 31.12.2005 31.12.2004<br />
in EUR ’000<br />
Up to one year . . . . . . . . . . . . . . . . . . . . . . . . . . . . . . . . . . . . . . . . . . . . . . . 109,762 59,600<br />
From one to five years. . . . . . . . . . . . . . . . . . . . . . . . . . . . . . . . . . . . . . . . . . 434,872 569,000<br />
From five to ten years . . . . . . . . . . . . . . . . . . . . . . . . . . . . . . . . . . . . . . . . . . 276,167 377,700<br />
More than ten years . . . . . . . . . . . . . . . . . . . . . . . . . . . . . . . . . . . . . . . . . . . 426,565 499,791<br />
Total ....................................................... 1,247,366 1,506,091<br />
Market value ................................................ 1,330,900 1,617,213<br />
6. OTHER SECURITIES<br />
During the reporting period, financial instruments held as capital assets were composed as<br />
follows:<br />
Financial instruments<br />
held to maturity<br />
Financial instruments<br />
available for sale Trading portfolio Fair Value Option<br />
Detail 31.12.2005 31.12.2004 31.12.2005 31.12.2004 31.12.2005 31.12.2004 31.12.2005 31.12.2004<br />
in EUR ’000<br />
As of 31.12 of preceding year . . . . . . 173,799 128,832 8,049,194 6,699,667 324,679 313,127 0 0<br />
Additions . . . . . . . . . . . . . . . .... 89,434 95,018 4,347,597 3,772,455 192,544 173,374 128,444 0<br />
Disposals . . . . . . . . . . . . . . .... �25,264 �66,251 �2,530,274 �2,774,623 �58,401 �178,306 �56,234 0<br />
Currency gains and losses recognised<br />
as income and expenses . . . .... 4,771 9,449 37,579 25,920 4,884 3,455 �355 0<br />
Change in valuation recognised as<br />
income. . . . . . . . . . . . . . . .... 3,770 6,768 0 0 28,041 13,029 1,400 0<br />
Change in valuation not affecting<br />
income. . . . . . . . . . . . . . . .... 0 0 405,178 336,948 0 0 0 0<br />
Impairment . . . . . . . . . . . . . . . . . 0 �17 �2,725 �11,173 0 0 0 0<br />
Status as of 31.12. ............ 246,510 173,799 10,306,549 8,049,194 491,747 324,679 73,255 0<br />
The Group received a total of EUR 2,592.855 million from the sale of available-for-sale financial<br />
instruments in 2005, realising a gain of EUR 85,151 million and a loss of EUR 22,570 million. Sales<br />
from the trading portfolio resulted in realised gains of EUR 40,173 million and realised losses of<br />
EUR 3,080 million in 2005.<br />
Financial instruments held to maturity may be shown as follows:<br />
Acquisition Costs<br />
Carried Forward Fair Value<br />
Held to Maturity 31.12.2005 31.12.2004 31.12.2005 31.12.2004<br />
in EUR ’000<br />
Government loans . . . . . . . . . . . . . . . . . . . . . . . . . . . 143,973 103,410 155,202 108,562<br />
Loans to business. . . . . . . . . . . . . . . . . . . . . . . . . . . . 102,537 70,389 109,714 75,753<br />
Total. ..................................... 246,510 173,799 264,916 184,315<br />
Financial instruments available for sale may be shown as follows:<br />
Amortized<br />
acquisition costs<br />
Unrealised<br />
Gains<br />
Unrealised<br />
Losses Fair Value<br />
Available for Sale 31.12.05 31.12.04 31.12.05 31.12.04 31.12.05 31.12.04 31.12.05 31.12.04<br />
in EUR ’000<br />
Non fixed-income . . . . . . . . . . . . . . . . . . 3,048,018 2,063,616 362,804 263,580 �5,806 �61,139 3,405.016 2,266,057<br />
Shares . . . . . . . . . . . . . . . . . . . . . . . 671,680 635,001 270,713 207,669 �2,487 �22,104 939,906 820,566<br />
Unit funds . . . . . . . . . . . . . . . . . . . . . 1,987,688 1,137,792 68,222 40,145 �2,830 �39,035 2,053,080 1,138,902<br />
Other . . . . . . . . . . . . . . . . . . . . . . . . 388,650 290,823 23,869 15,766 �489 0 412,030 306,589<br />
Fixed income . . . . . . . . . . . . . . . . . . . . 6,544,854 5,624,170 378,877 163,859 �22,198 �4,892 6,901,533 5,783,137<br />
Bonds and other securities of affiliated<br />
companies . . . . . . . . . . . . . . . . . . . 29,135 22,035 0 0 0 0 29,135 22,035<br />
Bonds and other securities of ownership<br />
interests . . . . . . . . . . . . . . . . . . . . . 172,828 167,970 17,319 268 �31 0 190,116 168,238<br />
Other fixed-income securities . . . . . . . . . 6,342,891 5,434,165 361,558 163,591 �22,167 �4,892 6,682,282 5,592,864<br />
Total. ......................... 9,592,872 7,687,786 741,681 427,439 �28,004 �66,031 10,306,549 8,049,194<br />
F-195