Erste Bank JPMorgan Merrill Lynch International
Erste Bank JPMorgan Merrill Lynch International
Erste Bank JPMorgan Merrill Lynch International

You also want an ePaper? Increase the reach of your titles
YUMPU automatically turns print PDFs into web optimized ePapers that Google loves.
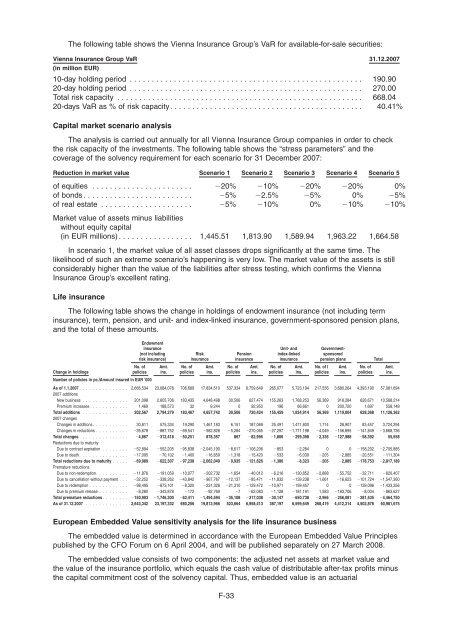
The following table shows the Vienna Insurance Group’s VaR for available-for-sale securities:<br />
Vienna Insurance Group VaR 31.12.2007<br />
(in million EUR)<br />
10-day holding period . . . . . . . . . . . . . . . . . . . . . . . . . . . . . . . . . . . . . . . . . . . . . . . . . . . . . 190.90<br />
20-day holding period . . . . . . . . . . . . . . . . . . . . . . . . . . . . . . . . . . . . . . . . . . . . . . . . . . . . . 270.00<br />
Total risk capacity . . . . . . . . . . . . . . . . . . . . . . . . . . . . . . . . . . . . . . . . . . . . . . . . . . . . . . . . 668.04<br />
20-days VaR as % of risk capacity. . . . . . . . . . . . . . . . . . . . . . . . . . . . . . . . . . . . . . . . . . . . 40.41%<br />
Capital market scenario analysis<br />
The analysis is carried out annually for all Vienna Insurance Group companies in order to check<br />
the risk capacity of the investments. The following table shows the “stress parameters” and the<br />
coverage of the solvency requirement for each scenario for 31 December 2007:<br />
Reduction in market value Scenario 1 Scenario 2 Scenario 3 Scenario 4 Scenario 5<br />
of equities . . . . . . . . . . . . . . . . . . . . . . . �20% �10% �20% �20% 0%<br />
of bonds . . . . . . . . . . . . . . . . . . . . . . . . . �5% �2.5% �5% 0% �5%<br />
of real estate . . . . . . . . . . . . . . . . . . . . .<br />
Market value of assets minus liabilities<br />
without equity capital<br />
�5% �10% 0% �10% �10%<br />
(in EUR millions) . . . . . . . . . . . . . . . . . 1,445.51 1,813.90 1,589.94 1,963.22 1,664.58<br />
In scenario 1, the market value of all asset classes drops significantly at the same time. The<br />
likelihood of such an extreme scenario’s happening is very low. The market value of the assets is still<br />
considerably higher than the value of the liabilities after stress testing, which confirms the Vienna<br />
Insurance Group’s excellent rating.<br />
Life insurance<br />
The following table shows the change in holdings of endowment insurance (not including term<br />
insurance), term, pension, and unit- and index-linked insurance, government-sponsored pension plans,<br />
and the total of these amounts.<br />
Change in holdings<br />
Endowment<br />
insurance<br />
(not including<br />
risk insurance)<br />
No. of<br />
policies<br />
Amt.<br />
ins.<br />
No. of<br />
policies<br />
Risk<br />
insurance<br />
Amt.<br />
ins.<br />
No. of<br />
policies<br />
Pension<br />
insurance<br />
Amt.<br />
ins.<br />
No. of<br />
policies<br />
Unit- and<br />
index-linked<br />
insurance<br />
Amt.<br />
ins.<br />
Governmentsponsored<br />
pension plans Total<br />
Number of policies in pc./Amount insured in EUR ’000<br />
As of 1.1.2007 . . . . . . . . . . . . . . .<br />
2007 additions<br />
2,666,534 23,084,078 706,689 17,834,510 537,334 6,759,649 265,077 5,723,194 217,556 3,680,264 4,393,190 57,081,694<br />
New business . . . . . . . . . . . . . . 201,098 2,605,706 183,435 4,648,498 30,506 627,474 155,263 1,768,253 56,369 918,284 626,671 10,568,214<br />
Premium increases . . . . . . . . . . . 1,469 188,573 32 9,244 0 92,950 196 66,661 0 200,720 1,697 558,148<br />
Total additions . . . . . . . . . . . . . .<br />
2007 changes<br />
202,567 2,794,279 183,467 4,657,742 30,506 720,424 155,459 1,834,914 56,369 1,119,004 628,368 11,126,362<br />
Changes in additions. . . . . . . . . . . 30,811 575,334 19,290 1,461,183 6,151 187,069 25,491 1,471,800 1,714 28,907 83,457 3,724,294<br />
Changes in reductions . . . . . . . . . . �35,678 �887,752 �69,541 �582,826 �5,284 �270,065 �27,297 �1,771,198 �4,049 �156,895 �141,849 �3,668,736<br />
Total changes . . . . . . . . . . . . . . .<br />
Reductions due to maturity<br />
�4,867 �312,418 �50,251 878,357 867 �82,996 �1,806 �299,398 �2,335 �127,988 �58,392 55,558<br />
Due to contract expiration . . . . . . . . �52,894 �552,205 �95,838 �2,045,190 �8,617 �106,206 �853 �2,284 0 0 �158,202 �2,705,885<br />
Due to death . . . . . . . . . . . . . . . �17,095 �70,102 �1,400 �16,859 �1,318 �15,420 �533 �6,039 �205 �2,885 �20,551 �111,304<br />
Total reductions due to maturity . . . . .<br />
Premature reductions<br />
�69,989 �622,307 �97,238 �2,062,049 �9,935 �121,626 �1,386 �8,323 �205 �2,885 �178,753 �2,817,189<br />
Due to non-redemption. . . . . . . . . . �11,876 �191,059 �10,077 �202,732 �1,654 �40,012 �6,216 �130,852 �2,888 �55,752 �32,711 �620,407<br />
Due to cancellation without payment . . . �32,252 �338,262 �43,842 �967,767 �12,137 �85,471 �11,832 �139,238 �1,661 �16,623 �101,724 �1,547,360<br />
Due to redemption . . . . . . . . . . . . �98,495 �873,101 �8,320 �231,326 �21,310 �129,472 �10,971 �199,457 0 0 �139,096 �1,433,356<br />
Due to premium release . . . . . . . . . �8,280 �343,878 �172 �92,769 �7 �62,083 �1,128 �181,191 1,583 �183,706 �8,004 �863,627<br />
Total premature reductions . . . . . . . . �150,903 �1,746,300 �62,411 �1,494,594 �35,108 �317,038 �30,147 �650,738 �2,966 �256,081 �281,535 �4,464,750<br />
As of 31.12.2007 . . . . . . . . . . . . . 2,643,342 23,197,332 680,256 19,813,966 523,664 6,958,413 387,197 6,599,649 268,419 4,412,314 4,502,878 60,981,675<br />
No. of I<br />
policies<br />
European Embedded Value sensitivity analysis for the life insurance business<br />
The embedded value is determined in accordance with the European Embedded Value Principles<br />
published by the CFO Forum on 6 April 2004, and will be published separately on 27 March 2008.<br />
The embedded value consists of two components: the adjusted net assets at market value and<br />
the value of the insurance portfolio, which equals the cash value of distributable after-tax profits minus<br />
the capital commitment cost of the solvency capital. Thus, embedded value is an actuarial<br />
F-33<br />
Amt.<br />
ins.<br />
No. of<br />
policies<br />
Amt.<br />
ins.