Libro_Tributacion-para-el-desarrollo
Libro_Tributacion-para-el-desarrollo
Libro_Tributacion-para-el-desarrollo

You also want an ePaper? Increase the reach of your titles
YUMPU automatically turns print PDFs into web optimized ePapers that Google loves.
wwww.cepchile.cl CEP-CIEPLAN, 2013<br />
Capítulo 2. Gastos tributarios y evasión tributaria en Chile: evaluación y propuestas<br />
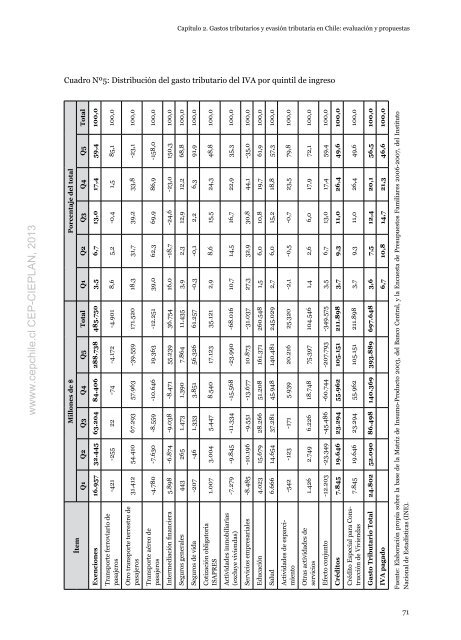
Cuadro nº5: Distribución d<strong>el</strong> gasto tributario d<strong>el</strong> iVa por quintil de ingreso<br />
Millones de $ Porcentaje d<strong>el</strong> total<br />
Ítem<br />
Q1 Q2 Q3 Q4 Q5 Total Q1 Q2 Q3 Q4 Q5 Total<br />
Exenciones 16.957 32.445 63.204 84.406 288.738 485.750 3,5 6,7 13,0 17,4 59,4 100,0<br />
-421 -255 22 -74 -4.172 -4.901 8,6 5,2 -0,4 1,5 85,1 100,0<br />
Transporte ferroviario de<br />
pasajeros<br />
31.412 54.410 67.293 57.963 -39.559 171.520 18,3 31,7 39,2 33,8 -23,1 100,0<br />
Otro transporte terrestre de<br />
pasajeros<br />
-4.780 -7.630 -8.559 -10.646 19.363 -12.251 39,0 62,3 69,9 86,9 -158,0 100,0<br />
Transporte aéreo de<br />
pasajeros<br />
intermediación financiera 5.898 -6.874 -9.038 -8.471 55.239 36.754 16,0 -18,7 -24,6 -23,0 150,3 100,0<br />
Seguros generales 443 265 1.473 1.390 7.864 11.435 3,9 2,3 12,9 12,2 68,8 100,0<br />
Seguros de vida -207 -46 1.333 3.851 56.326 61.257 -0,3 -0,1 2,2 6,3 91,9 100,0<br />
1.007 3.004 5.447 8.540 17.123 35.121 2,9 8,6 15,5 24,3 48,8 100,0<br />
Cotización obligatoria<br />
iSaPRES<br />
-7.279 -9.845 -11.334 -15.568 -23.990 -68.016 10,7 14,5 16,7 22,9 35,3 100,0<br />
actividades inmobiliarias<br />
(excluye viviendas)<br />
Servicios empresariales -8.485 -10.196 -9.551 -13.677 10.873 -31.037 27,3 32,9 30,8 44,1 -35,0 100,0<br />
Educación 4.023 15.679 28.266 51.208 161.371 260.548 1,5 6,0 10,8 19,7 61,9 100,0<br />
Salud 6.666 14.654 37.281 45.948 140.481 245.029 2,7 6,0 15,2 18,8 57,3 100,0<br />
-542 -123 -171 5.939 20.216 25.320 -2,1 -0,5 -0,7 23,5 79,8 100,0<br />
actividades de esparcimiento<br />
1.426 2.749 6.226 18.748 75.397 104.546 1,4 2,6 6,0 17,9 72,1 100,0<br />
Otras actividades de<br />
servicios<br />
Efecto conjunto -12.203 -23.349 -45.486 -60.744 -207.793 -349.575 3,5 6,7 13,0 17,4 59,4 100,0<br />
Créditos 7.845 19.646 23.294 55.962 105.151 211.898 3,7 9,3 11,0 26,4 49,6 100,0<br />
Crédito Especial <strong>para</strong> Cons-<br />
7.845 19.646 23.294 55.962 105.151 211.898 3,7 9,3 11,0 26,4 49,6 100,0<br />
trucción de Viviendas<br />
Gasto Tributario Total 24.802 52.090 86.498 140.369 393.889 697.648 3,6 7,5 12,4 20,1 56,5 100,0<br />
IVA pagado 6,7 10,8 14,7 21,3 46,6 100,0<br />
Fuente: Elaboración propia sobre la base de la Matriz de insumo-Producto 2003, d<strong>el</strong> Banco Central, y la Encuesta de Presupuestos Familiares 2006-2007, d<strong>el</strong> instituto<br />
nacional de Estadísticas (inE).<br />
71