- Page 1 and 2: PLAN MUNICIPAL DE DESARROLLO URBANO
- Page 3 and 4: PLAN MUNICIPAL DE DESARROLLO URBANO
- Page 5 and 6: PLAN MUNICIPAL DE DESARROLLO URBANO
- Page 7 and 8: PLAN MUNICIPAL DE DESARROLLO URBANO
- Page 9 and 10: Infraestructura Vialidad y Transpor
- Page 11 and 12: PLAN MUNICIPAL DE DESARROLLO URBANO
- Page 13 and 14: PLAN MUNICIPAL DE DESARROLLO URBANO
- Page 15 and 16: PLAN MUNICIPAL DE DESARROLLO URBANO
- Page 17 and 18: 20.0 18.0 16.0 14.0 12.0 10.0 8.0 6
- Page 19 and 20: PLAN MUNICIPAL DE DESARROLLO URBANO
- Page 21 and 22: PLAN MUNICIPAL DE DESARROLLO URBANO
- Page 23 and 24: PLAN MUNICIPAL DE DESARROLLO URBANO
- Page 25 and 26: PLAN MUNICIPAL DE DESARROLLO URBANO
- Page 27 and 28: • Fraccionamientos. 1. Unidad mag
- Page 29: PLAN MUNICIPAL DE DESARROLLO URBANO
- Page 33 and 34: 2.2.2 Aspectos Económicos PLAN MUN
- Page 35 and 36: Unidades económicas censables y ev
- Page 37 and 38: PLAN MUNICIPAL DE DESARROLLO URBANO
- Page 39 and 40: PLAN MUNICIPAL DE DESARROLLO URBANO
- Page 41 and 42: PLAN MUNICIPAL DE DESARROLLO URBANO
- Page 43 and 44: PLAN MUNICIPAL DE DESARROLLO URBANO
- Page 45 and 46: HABITACIONAL EQUIPAMIENTO NATURAL A
- Page 47 and 48: Vivienda. PLAN MUNICIPAL DE DESARRO
- Page 49 and 50: PLAN MUNICIPAL DE DESARROLLO URBANO
- Page 51 and 52: PLAN MUNICIPAL DE DESARROLLO URBANO
- Page 53 and 54: PLAN MUNICIPAL DE DESARROLLO URBANO
- Page 55 and 56: 2.4.2 Infraestructura Sanitaria PLA
- Page 57 and 58: PLAN MUNICIPAL DE DESARROLLO URBANO
- Page 59 and 60: PLAN MUNICIPAL DE DESARROLLO URBANO
- Page 61 and 62: PLAN MUNICIPAL DE DESARROLLO URBANO
- Page 63 and 64: PLAN MUNICIPAL DE DESARROLLO URBANO
- Page 65 and 66: PLAN MUNICIPAL DE DESARROLLO URBANO
- Page 67 and 68: Elemento: Primarias. PLAN MUNICIPAL
- Page 69 and 70: PLAN MUNICIPAL DE DESARROLLO URBANO
- Page 71 and 72: PLAN MUNICIPAL DE DESARROLLO URBANO
- Page 73 and 74: 2.5.4 Equipamiento para el Comercio
- Page 75 and 76: PLAN MUNICIPAL DE DESARROLLO URBANO
- Page 77 and 78: 2.6 SERVICIOS PÚBLICOS 2.6.1 Segur
- Page 79 and 80: PLAN MUNICIPAL DE DESARROLLO URBANO
- Page 81 and 82:
PLAN MUNICIPAL DE DESARROLLO URBANO
- Page 83 and 84:
PROBLEMÁTICA URBANA INFRAESTRUCTUR
- Page 85 and 86:
3 PROSPECTIVA 3.1 ESCENARIOS TENDEN
- Page 87 and 88:
8 7 6 5 4 3 2 1 0 6.78 2.26 PLAN MU
- Page 89 and 90:
PLAN MUNICIPAL DE DESARROLLO URBANO
- Page 91 and 92:
Plan de Desarrollo del Estado de M
- Page 93 and 94:
PLAN MUNICIPAL DE DESARROLLO URBANO
- Page 95 and 96:
PLAN MUNICIPAL DE DESARROLLO URBANO
- Page 97 and 98:
PLAN MUNICIPAL DE DESARROLLO URBANO
- Page 99 and 100:
PLAN MUNICIPAL DE DESARROLLO URBANO
- Page 101 and 102:
PLAN MUNICIPAL DE DESARROLLO URBANO
- Page 103 and 104:
PLAN MUNICIPAL DE DESARROLLO URBANO
- Page 105 and 106:
PLAN MUNICIPAL DE DESARROLLO URBANO
- Page 107 and 108:
PLAN MUNICIPAL DE DESARROLLO URBANO
- Page 109 and 110:
Secundaria general 0 Aulas El equip
- Page 111 and 112:
PLAN MUNICIPAL DE DESARROLLO URBANO
- Page 113 and 114:
PLAN MUNICIPAL DE DESARROLLO URBANO
- Page 115 and 116:
4.1.2 Políticas de aprovechamiento
- Page 117 and 118:
4.2.2 Oferta del suelo y aprovecham
- Page 119 and 120:
PLAN MUNICIPAL DE DESARROLLO URBANO
- Page 121 and 122:
PLAN MUNICIPAL DE DESARROLLO URBANO
- Page 123 and 124:
4.2.10 Prevención y atención de r
- Page 125 and 126:
5.2 ESTRATEGIAS DE ORDENAMIENTO URB
- Page 127 and 128:
Atención a las necesidades de desa
- Page 129 and 130:
Por las condiciones medioambientale
- Page 131 and 132:
Áreas Urbanizables PLAN MUNICIPAL
- Page 133 and 134:
PLAN MUNICIPAL DE DESARROLLO URBANO
- Page 135 and 136:
PLAN MUNICIPAL DE DESARROLLO URBANO
- Page 137 and 138:
PLAN MUNICIPAL DE DESARROLLO URBANO
- Page 139 and 140:
PLAN MUNICIPAL DE DESARROLLO URBANO
- Page 141 and 142:
PLAN MUNICIPAL DE DESARROLLO URBANO
- Page 143 and 144:
PLAN MUNICIPAL DE DESARROLLO URBANO
- Page 145 and 146:
PLAN MUNICIPAL DE DESARROLLO URBANO
- Page 147 and 148:
PLAN MUNICIPAL DE DESARROLLO URBANO
- Page 149 and 150:
Alumbrado público PLAN MUNICIPAL D
- Page 151 and 152:
PLAN MUNICIPAL DE DESARROLLO URBANO
- Page 153 and 154:
PLAN MUNICIPAL DE DESARROLLO URBANO
- Page 155:
PLAN MUNICIPAL DE DESARROLLO URBANO
- Page 158 and 159:
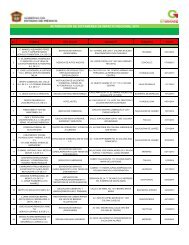
CLAVE PROGRAMATICA PRESUPUESTAL ACC
- Page 160 and 161:
CLAVE PROGRAMATICA PRESUPUESTAL ACC
- Page 162 and 163:
CLAVE PROGRAMATICA PRESUPUESTAL ACC
- Page 164 and 165:
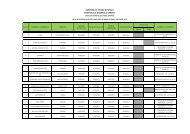
CLAVE PROGRAMATICA PRESUPUESTAL EST
- Page 166 and 167:
CLAVE PROGRAMATICA PRESUPUESTAL ACC
- Page 168 and 169:
CLAVE PROGRAMATICA PRESUPUESTAL ACC
- Page 170 and 171:
CLAVE PROGRAMATICA PRESUPUESTAL EST
- Page 172 and 173:
CLAVE PROGRAMATICA PRESUPUESTAL EST
- Page 174 and 175:
CLAVE PROGRAMATICA PRESUPUESTAL ACC
- Page 176 and 177:
CLAVE PROGRAMATICA PRESUPUESTAL ACC
- Page 178 and 179:
CLAVE PROGRAMATICA PRESUPUESTAL ACC
- Page 180 and 181:
CLAVE PROGRAMATICA PRESUPUESTAL ACC
- Page 182 and 183:
CLAVE PROGRAMATICA PRESUPUESTAL ACC
- Page 184 and 185:
CLAVE PROGRAMATICA PRESUPUESTAL EST
- Page 186 and 187:
CLAVE PRGRAMATICA PRESUPUESTAL ACCI
- Page 188 and 189:
7 INSTRUMENTACIÓN PLAN MUNICIPAL D
- Page 190 and 191:
VENTA DE CARROCERIAS, TIANGUIS DE A
- Page 192 and 193:
PLAN MUNICIPAL DE DESARROLLO URBANO
- Page 194 and 195:
PLAN MUNICIPAL DE DESARROLLO URBANO
- Page 196 and 197:
D) Industria Petrolera. E) Industri
- Page 198 and 199:
PLAN MUNICIPAL DE DESARROLLO URBANO
- Page 200 and 201:
Sobre mobiliario urbano. PLAN MUNIC
- Page 202 and 203:
PLAN MUNICIPAL DE DESARROLLO URBANO
- Page 204 and 205:
PLAN MUNICIPAL DE DESARROLLO URBANO
- Page 206 and 207:
PLAN MUNICIPAL DE DESARROLLO URBANO
- Page 208 and 209:
• Área de espera de consumidores
- Page 210 and 211:
PLAN MUNICIPAL DE DESARROLLO URBANO
- Page 212 and 213:
PLAN MUNICIPAL DE DESARROLLO URBANO
- Page 214 and 215:
* Refaccionaría automotriz. * Tall
- Page 216 and 217:
PLAN MUNICIPAL DE DESARROLLO URBANO
- Page 218 and 219:
Elemento Requerimiento (Nivel Medio
- Page 220 and 221:
Elemento Agencia de correo Centro i
- Page 222 and 223:
PLAN MUNICIPAL DE DESARROLLO URBANO
- Page 224 and 225:
PLAN MUNICIPAL DE DESARROLLO URBANO
- Page 226 and 227:
PLAN MUNICIPAL DE DESARROLLO URBANO
- Page 228 and 229:
Comercio de Materiales para Constru
- Page 230 and 231:
Hoteles, Moteles, Casas de Huésped
- Page 232 and 233:
PLAN MUNICIPAL DE DESARROLLO URBANO
- Page 234 and 235:
Restricciones federales y estatales
- Page 236 and 237:
PLAN MUNICIPAL DE DESARROLLO URBANO
- Page 238 and 239:
PLAN MUNICIPAL DE DESARROLLO URBANO
- Page 240 and 241:
PLAN MUNICIPAL DE DESARROLLO URBANO
- Page 242 and 243:
Pesado 113 1 TAS 208.6 Dise210ño L
- Page 244 and 245:
PLAN MUNICIPAL DE DESARROLLO URBANO
- Page 246 and 247:
PLAN MUNICIPAL DE DESARROLLO URBANO
- Page 248 and 249:
PLAN MUNICIPAL DE DESARROLLO URBANO
- Page 250 and 251:
7.2 INSTRUMENTOS FISCALES Y FINANCI
- Page 252 and 253:
PLAN MUNICIPAL DE DESARROLLO URBANO
- Page 254 and 255:
PLAN MUNICIPAL DE DESARROLLO URBANO
- Page 256 and 257:
8 ANEXO GRÁFICO PLAN MUNICIPAL DE
- Page 258 and 259:
PLAN MUNICIPAL DE DESARROLLO URBANO
- Page 260:
E6A Imagen Urbana (Zona 1 Cabecera