Educación para todos: el imperativo de la calidad - unesdoc - Unesco
Educación para todos: el imperativo de la calidad - unesdoc - Unesco
Educación para todos: el imperativo de la calidad - unesdoc - Unesco

Create successful ePaper yourself
Turn your PDF publications into a flip-book with our unique Google optimized e-Paper software.
EVALUACIÓN DE LOS PROGRESOS HACIA LOS OBJETIVOS DE LA EPT / 139<br />
La <strong>calidad</strong> <strong>de</strong> <strong>la</strong> educación<br />
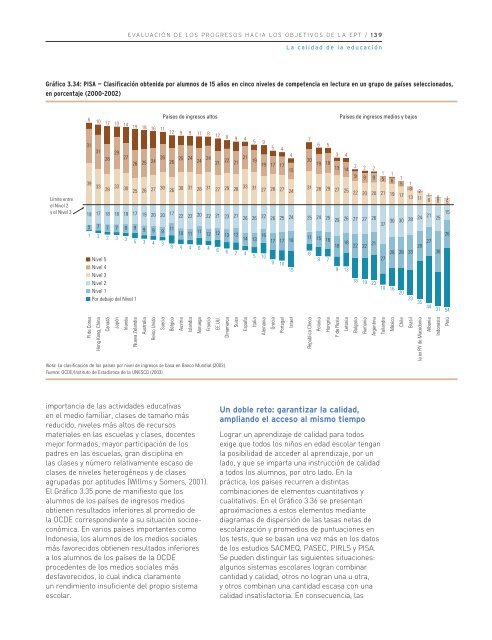
Gráfico 3.34: PISA — C<strong>la</strong>sificación obtenida por alumnos <strong>de</strong> 15 años en cinco niv<strong>el</strong>es <strong>de</strong> competencia en lectura en un grupo <strong>de</strong> países s<strong>el</strong>eccionados,<br />
en porcentaje (2000-2002)<br />
6<br />
10<br />
17<br />
10<br />
Países <strong>de</strong> ingresos altos<br />
14 19 18 16 11 12 9 9 11 8 12 8 9 4<br />
Países <strong>de</strong> ingresos medios y bajos<br />
Límite entre<br />
<strong>el</strong> Niv<strong>el</strong> 2<br />
y <strong>el</strong> Niv<strong>el</strong> 3<br />
5<br />
7<br />
9<br />
31<br />
6 5<br />
5<br />
31<br />
4<br />
29<br />
3 4<br />
28 27<br />
26 25 24 26 26 25 24 24 24 20<br />
21 22 21 4<br />
21 19 19 17 17 19 18<br />
2 2 15<br />
13 14 2<br />
1<br />
9<br />
1<br />
9 9 5 1<br />
6<br />
39 33 33 28 30 25 26 27 30 31 1<br />
26 30 31 28 31 27 29 28 33 5<br />
31 27 28 27 24<br />
28 29 27 25 3<br />
22 20 20 21 2<br />
19 17 13 1<br />
11 8<br />
19 17 18 18 18 17 19 20 20 17 22 22 20 22 21 23 21 26 26 22 26 25 24<br />
5 7 7 7 8 9 9 9 9<br />
1 3 2 3 3<br />
Niv<strong>el</strong> 5<br />
Niv<strong>el</strong> 4<br />
Niv<strong>el</strong> 3<br />
Niv<strong>el</strong> 2<br />
Niv<strong>el</strong> 1<br />
Por <strong>de</strong>bajo d<strong>el</strong> Niv<strong>el</strong> 1<br />
5 3 4 3<br />
11<br />
10 11<br />
11 12 12 13 12 14 13<br />
16<br />
8 4 4 6 4 6 6 7 4<br />
5 10<br />
17 17 18<br />
9 10<br />
15<br />
0<br />
6<br />
1<br />
5<br />
25 24 25 29 26 27 27 26<br />
30<br />
37 30 28 24 21 15<br />
25<br />
11 15 16<br />
18 18 22 22 21<br />
6<br />
28 28 33<br />
28 27 38<br />
9 7<br />
27<br />
9 13<br />
18 19 23<br />
10 16<br />
20<br />
23 35<br />
44<br />
31 54<br />
26<br />
R <strong>de</strong> Corea<br />
Hong Kong, China<br />
Canadá<br />
Japón<br />
Ir<strong>la</strong>nda<br />
Nueva Z<strong>el</strong>andia<br />
Australia<br />
Reino Unido<br />
Suecia<br />
Bélgica<br />
Austria<br />
Is<strong>la</strong>ndia<br />
Noruega<br />
Francia<br />
EE.UU.<br />
Dinamarca<br />
Suiza<br />
España<br />
Italia<br />
Alemania<br />
Grecia<br />
Portugal<br />
Isra<strong>el</strong><br />
República Checa<br />
Polonia<br />
Hungría<br />
F <strong>de</strong> Rusia<br />
Letonia<br />
Bulgaria<br />
Rumania<br />
Argentina<br />
Tai<strong>la</strong>ndia<br />
México<br />
Chile<br />
Brasil<br />
<strong>la</strong> ex RY <strong>de</strong> Macedonia<br />
Albania<br />
Indonesia<br />
Perú<br />
Nota: La c<strong>la</strong>sificación <strong>de</strong> los países por niv<strong>el</strong> <strong>de</strong> ingresos se basa en Banco Mundial (2003).<br />
Fuente: OCDE/Instituto <strong>de</strong> Estadística <strong>de</strong> <strong>la</strong> UNESCO (2003).<br />
importancia <strong>de</strong> <strong>la</strong>s activida<strong>de</strong>s educativas<br />
en <strong>el</strong> medio familiar, c<strong>la</strong>ses <strong>de</strong> tamaño más<br />
reducido, niv<strong>el</strong>es más altos <strong>de</strong> recursos<br />
materiales en <strong>la</strong>s escu<strong>el</strong>as y c<strong>la</strong>ses, docentes<br />
mejor formados, mayor participación <strong>de</strong> los<br />
padres en <strong>la</strong>s escu<strong>el</strong>as, gran disciplina en<br />
<strong>la</strong>s c<strong>la</strong>ses y número r<strong>el</strong>ativamente escaso <strong>de</strong><br />
c<strong>la</strong>ses <strong>de</strong> niv<strong>el</strong>es heterogéneos y <strong>de</strong> c<strong>la</strong>ses<br />
agrupadas por aptitu<strong>de</strong>s (Willms y Somers, 2001).<br />
El Gráfico 3.35 pone <strong>de</strong> manifiesto que los<br />
alumnos <strong>de</strong> los países <strong>de</strong> ingresos medios<br />
obtienen resultados inferiores al promedio <strong>de</strong><br />
<strong>la</strong> OCDE correspondiente a su situación socioeconómica.<br />
En varios países importantes como<br />
Indonesia, los alumnos <strong>de</strong> los medios sociales<br />
más favorecidos obtienen resultados inferiores<br />
a los alumnos <strong>de</strong> los países <strong>de</strong> <strong>la</strong> OCDE<br />
proce<strong>de</strong>ntes <strong>de</strong> los medios sociales más<br />
<strong>de</strong>sfavorecidos, lo cual indica c<strong>la</strong>ramente<br />
un rendimiento insuficiente d<strong>el</strong> propio sistema<br />
esco<strong>la</strong>r.<br />
Un doble reto: garantizar <strong>la</strong> <strong>calidad</strong>,<br />
ampliando <strong>el</strong> acceso al mismo tiempo<br />
Lograr un aprendizaje <strong>de</strong> <strong>calidad</strong> <strong>para</strong> <strong>todos</strong><br />
exige que <strong>todos</strong> los niños en edad esco<strong>la</strong>r tengan<br />
<strong>la</strong> posibilidad <strong>de</strong> acce<strong>de</strong>r al aprendizaje, por un<br />
<strong>la</strong>do, y que se imparta una instrucción <strong>de</strong> <strong>calidad</strong><br />
a <strong>todos</strong> los alumnos, por otro <strong>la</strong>do. En <strong>la</strong><br />
práctica, los países recurren a distintas<br />
combinaciones <strong>de</strong> <strong>el</strong>ementos cuantitativos y<br />
cualitativos. En <strong>el</strong> Gráfico 3.36 se presentan<br />
aproximaciones a estos <strong>el</strong>ementos mediante<br />
diagramas <strong>de</strong> dispersión <strong>de</strong> <strong>la</strong>s tasas netas <strong>de</strong><br />
esco<strong>la</strong>rización y promedios <strong>de</strong> puntuaciones en<br />
los tests, que se basan una vez más en los datos<br />
<strong>de</strong> los estudios SACMEQ, PASEC, PIRLS y PISA.<br />
Se pue<strong>de</strong>n distinguir <strong>la</strong>s siguientes situaciones:<br />
algunos sistemas esco<strong>la</strong>res logran combinar<br />
cantidad y <strong>calidad</strong>, otros no logran una u otra,<br />
y otros combinan una cantidad escasa con una<br />
<strong>calidad</strong> insatisfactoria. En consecuencia, <strong>la</strong>s