- Page 1:
The North Atlantic Fisheries, 1100-
- Page 4 and 5:
Fiskeri- og Søfartsmuseets Studies
- Page 6 and 7:
Contents Jón Th.Thór with Kjartan
- Page 8 and 9:
north of the latitude of the Bay of
- Page 10 and 11:
eighteenth century when the Newfoun
- Page 12 and 13:
truck-system only two generations a
- Page 14 and 15:
history of fishing plays an importa
- Page 16 and 17:
available except for the very last
- Page 18 and 19:
Little has sofar been written on th
- Page 20 and 21:
has an emphasis on the life and wor
- Page 22 and 23:
scholarly research and only few con
- Page 24 and 25:
(Neskaupsstaður, 1983) Gíslason,
- Page 26 and 27:
Snæfellsnesi, Suðurnesjum og í V
- Page 28 and 29:
pattern of European economic develo
- Page 30 and 31:
Basques fished in the Atlantic and
- Page 32 and 33:
salt cod. Other sources, however, s
- Page 34 and 35:
in Tvøroyri, which in the 1920s be
- Page 36 and 37:
Nowadays the Danish term “klipfis
- Page 38 and 39:
transport by sea, if not daily then
- Page 40 and 41:
immediate post-war years, when the
- Page 42 and 43:
production capacity of all the fish
- Page 44 and 45:
heimskríggj. Eitt søguligt yvirli
- Page 46 and 47:
Lafto, Thorolf, ‘Fiskhandel’. K
- Page 49 and 50:
Whaling in the Faroe Islands, 1584-
- Page 51 and 52:
Pilot and bottlenose whaling has al
- Page 53 and 54:
Table 1 Number er of pilot whales c
- Page 55 and 56:
Sometimes, the pods of long-finned
- Page 57 and 58:
were soon established. In 1897 a se
- Page 59 and 60:
The Faroe Islands are placed far aw
- Page 61:
Joensen, J. P. ‘The Pilot Whale i
- Page 64 and 65:
The Greenland Fishery before 1914 S
- Page 66 and 67:
even more marked for the ordinary F
- Page 68 and 69:
The result of Norwegian pressure wa
- Page 70 and 71:
Greenland. The Lagting decided on 1
- Page 72 and 73:
1930/31 Patursson repeated the main
- Page 74 and 75:
All the major elements in the Faroe
- Page 76 and 77:
and the Home Secretary promised Par
- Page 78 and 79:
1) In recognition of the concession
- Page 80 and 81:
In 1938 the Fishery Committee of th
- Page 82 and 83:
the existing and future utilization
- Page 84 and 85:
seriously. The issue was given more
- Page 86 and 87:
Lagtingstidende, 1914-1940 (The pri
- Page 88 and 89:
Table III. Faroese Fisheries, 1917-
- Page 90 and 91:
variation. Several place names bear
- Page 92 and 93:
and the use of unpublished sources
- Page 94 and 95:
Greenland a whole world of comparis
- Page 96 and 97:
Industrial Plants in 1959 Besides C
- Page 98:
1990s. Due to expansion in other oc
- Page 101 and 102:
a) The transition in Southern Green
- Page 103 and 104:
Nolsøe, Karl, ‘Færøsk fiskeri
- Page 105 and 106:
Dutch Fisheries: An Historiographic
- Page 107 and 108:
The Infrastructure for Research on
- Page 109 and 110:
Years’ War (1586-1648) and the im
- Page 111 and 112:
The catch of cod and haddock has ne
- Page 113 and 114:
were active in the herring fishery.
- Page 115 and 116:
In 1719 the States General forbade
- Page 117 and 118:
15 lasts. Its average crew was abou
- Page 119 and 120:
H.A.H. Boelmans Kranenburg and J.P.
- Page 121 and 122:
The Sea Fisheries of the British Is
- Page 123 and 124:
qualitative and uncorroborated, the
- Page 125 and 126: fishing is clearly apparent in refe
- Page 127 and 128: the percentage was possibly higher.
- Page 129 and 130: across large expanses of sea. Moreo
- Page 131 and 132: This sudden contraction was of some
- Page 133 and 134: in English and Welsh ports is avail
- Page 135 and 136: eyond the means of the inland urban
- Page 137 and 138: A similar pattern of incremental in
- Page 139 and 140: crofting communities of the highlan
- Page 141 and 142: oceanographers might well provide h
- Page 143 and 144: R N W Robinson, ‘The English Fish
- Page 145 and 146: Norwegian Fisheries 1100-1970 Main
- Page 147 and 148: ejected. The new social and economi
- Page 149 and 150: In this early phase of commercial f
- Page 151 and 152: common contention of historians tha
- Page 153 and 154: The area which was dominated to the
- Page 155 and 156: heavier competition on the fish mar
- Page 157 and 158: and Lofoten reclaimed its pre-emine
- Page 159 and 160: Russian sailing merchants from the
- Page 161 and 162: experiment during a deep economic c
- Page 163 and 164: In the cod fisheries, conflict was
- Page 165 and 166: of the century, the number fell rap
- Page 167 and 168: Nordlandene (Oslo, 1993) Klepp, Asb
- Page 169 and 170: Fisheries in Western Sweden c1650-1
- Page 171 and 172: From the older, printed and non-pri
- Page 173 and 174: (National Archives) is the so calle
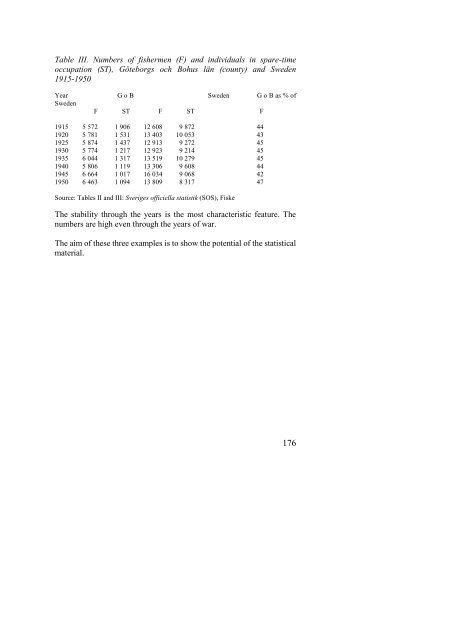
- Page 175: Statistics - some examples Table I.
- Page 179 and 180: 300,000 barrels from the Sound and
- Page 181 and 182: The wealth of monasteries around th
- Page 183 and 184: In order to assess the magnitude of
- Page 185 and 186: herring trade was to be challenged.
- Page 187 and 188: fisheries off the Scaw and other sm
- Page 189 and 190: which had been founded on a forbidd
- Page 191 and 192: good years around 1617-22. 334 Evid
- Page 193 and 194: from the fish trade to concentrate
- Page 195 and 196: Norway and 43% abroad, mainly to L
- Page 197 and 198: decade of the century did fishermen
- Page 199 and 200: districts are rounded sums). Howeve
- Page 201 and 202: decades the anchor seine was allowe
- Page 203 and 204: By 1995, the fishing industry seems
- Page 205 and 206: state G.F.C. Oeder will eventually
- Page 207 and 208: Contributors Bertil Andersson, PhD,
- Page 209 and 210: Statistical data on Dutch fishery:
- Page 211 and 212: Economische Zaken en Arbeid, 1933-1