Lagtingstidende, 1914-1940 (<strong>The</strong> printed county council minutes <strong>of</strong> the Faroe Islands) Landstingstidende, vide: Rigsdagstidende Løgtingstíðindi, vide: Lagtingstidende Mørkøre, Jógvan, ‘Class Interests and Nationalism in Faroese Politics’, <strong>North</strong> <strong>Atlantic</strong> Studies, vol. 3,1 (Århus 1991), 57-67 Nolsøe, K., ‘Færøsk fiskeri ved Grønland’, Grønland, (Copenhagen, 1973) 199-208 Patursson, Erlendur, Fiskiveiði–fiskimenn 1850-1939, I-II (Tórshavn, 1961) Patursson, Jóannes, Færøsk Politik (Tórshavn 1931) Rigsdagstidende, 1920-1940 Forhandlinger i Folketinget (Folketingstidende), yearly Forhandlinger i Landstinget (Landstingstidende), yearly Tillæg A, Lovforslag etc., yearly Tillæg C, Vedtagne Lovforslag, Beslutninger etc., yearly Rigsdags-årbogen, = Aarbog for Rigsdagssamlingen, 1920-40, (<strong>The</strong> <strong>of</strong>ficial parliamentary year-book, like ‘Hansard’, Copenhagen) Spanner, Søren, ‘Færøfiskeriet ved Grønland i 1920’erne – Kampen om færøske fiskeres adgang til fiskeri i grønlandske farvande 1924- 27.’ Unprinted MA-thesis, history (Aarhus <strong>University</strong>, 1982) Statistiske Meddelser, 4. Række, ff. Statistisk Aarbog, 1917-1939 (Copenhagen) Steining, Jørgen, ‘Rigsdagen og Færøerne’, Den danske Rigsdag 1849- 1949, VI, (Copenhagen 1953), 105-201 Steining, Jørgen, ‘Danmark og Island’, Den danske Rigsdag, VI, (1953), 313-410 Sveistrup, P. P.: ‘Rigsdagen og Grønland’, Den danske Rigsdag, VI, 260-287 Tingakrossur (Faroese newspaper, f. 1901, radical and autonomistic, some issues consulted, 1920s) Trap, J. P., Danmark, 5. ed., (Copenhagen 1970), XIV, ‘Grønland’, XIII, ‘Færøerne’ Tåning, Å. Vedel, Fiskeri- og Havundersøgelser ved Færøerne (Copenhagen 1943) Wåhlin, V., M. S. Lund, H. M. Kristensen and B. Tersbøl, Mellem færøsk og dansk politik 1917-1920 (Tórshavn & Århus 1994) Fig I. Greenlandic cod catches 1915-1965. Source: J.P. Trap, XIV, ‘Grønland’, 172 86
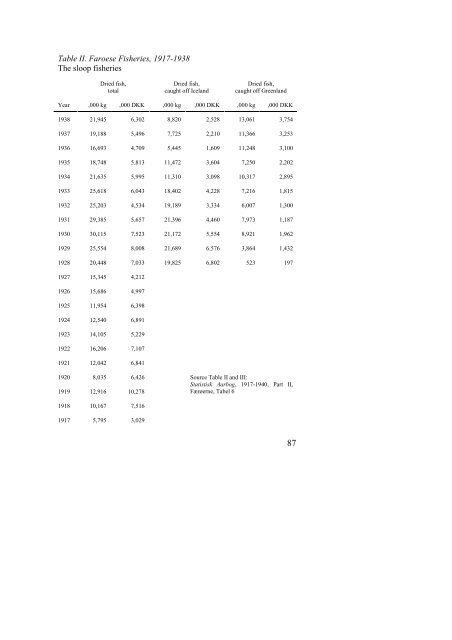
Table II. Faroese <strong>Fisheries</strong>, 1917-1938 <strong>The</strong> sloop fisheries Dried fish, total Dried fish, caught <strong>of</strong>f Iceland Dried fish, caught <strong>of</strong>f Greenland Year ,000 kg ,000 DKK ,000 kg ,000 DKK ,000 kg ,000 DKK 1938 21,945 6,302 8,820 2,528 13,061 3,754 1937 19,188 5,496 7,725 2,210 11,366 3,253 1936 16,693 4,709 5,445 1,609 11,248 3,100 1935 18,748 5,813 11,472 3,604 7,250 2,202 1934 21,635 5,995 11,310 3,098 10,317 2,895 1933 25,618 6,043 18,402 4,228 7,216 1,815 1932 25,203 4,534 19,189 3,334 6,007 1,300 1931 29,385 5,657 21,396 4,460 7,973 1,187 1930 30,115 7,523 21,172 5,554 8,921 1,962 1929 25,554 8,008 21,689 6,576 3,864 1,432 1928 20,448 7,033 19,825 6,802 523 197 1927 15,345 4,212 1926 15,686 4,997 1925 11,954 6,398 1924 12,540 6,891 1923 14,105 5,229 1922 16,206 7,107 1921 12,042 6,841 1920 8,035 6,426 Source Table II and III: Statistisk Aarbog, 1917-1940, Part II, 1919 12,916 10,278 Færøerne, Tabel 6 1918 10,167 7,516 1917 5,795 3,029 87
- Page 1:
The North Atlantic Fisheries, 1100-
- Page 4 and 5:
Fiskeri- og Søfartsmuseets Studies
- Page 6 and 7:
Contents Jón Th.Thór with Kjartan
- Page 8 and 9:
north of the latitude of the Bay of
- Page 10 and 11:
eighteenth century when the Newfoun
- Page 12 and 13:
truck-system only two generations a
- Page 14 and 15:
history of fishing plays an importa
- Page 16 and 17:
available except for the very last
- Page 18 and 19:
Little has sofar been written on th
- Page 20 and 21:
has an emphasis on the life and wor
- Page 22 and 23:
scholarly research and only few con
- Page 24 and 25:
(Neskaupsstaður, 1983) Gíslason,
- Page 26 and 27:
Snæfellsnesi, Suðurnesjum og í V
- Page 28 and 29:
pattern of European economic develo
- Page 30 and 31:
Basques fished in the Atlantic and
- Page 32 and 33:
salt cod. Other sources, however, s
- Page 34 and 35:
in Tvøroyri, which in the 1920s be
- Page 36 and 37: Nowadays the Danish term “klipfis
- Page 38 and 39: transport by sea, if not daily then
- Page 40 and 41: immediate post-war years, when the
- Page 42 and 43: production capacity of all the fish
- Page 44 and 45: heimskríggj. Eitt søguligt yvirli
- Page 46 and 47: Lafto, Thorolf, ‘Fiskhandel’. K
- Page 49 and 50: Whaling in the Faroe Islands, 1584-
- Page 51 and 52: Pilot and bottlenose whaling has al
- Page 53 and 54: Table 1 Number er of pilot whales c
- Page 55 and 56: Sometimes, the pods of long-finned
- Page 57 and 58: were soon established. In 1897 a se
- Page 59 and 60: The Faroe Islands are placed far aw
- Page 61: Joensen, J. P. ‘The Pilot Whale i
- Page 64 and 65: The Greenland Fishery before 1914 S
- Page 66 and 67: even more marked for the ordinary F
- Page 68 and 69: The result of Norwegian pressure wa
- Page 70 and 71: Greenland. The Lagting decided on 1
- Page 72 and 73: 1930/31 Patursson repeated the main
- Page 74 and 75: All the major elements in the Faroe
- Page 76 and 77: and the Home Secretary promised Par
- Page 78 and 79: 1) In recognition of the concession
- Page 80 and 81: In 1938 the Fishery Committee of th
- Page 82 and 83: the existing and future utilization
- Page 84 and 85: seriously. The issue was given more
- Page 88 and 89: Table III. Faroese Fisheries, 1917-
- Page 90 and 91: variation. Several place names bear
- Page 92 and 93: and the use of unpublished sources
- Page 94 and 95: Greenland a whole world of comparis
- Page 96 and 97: Industrial Plants in 1959 Besides C
- Page 98: 1990s. Due to expansion in other oc
- Page 101 and 102: a) The transition in Southern Green
- Page 103 and 104: Nolsøe, Karl, ‘Færøsk fiskeri
- Page 105 and 106: Dutch Fisheries: An Historiographic
- Page 107 and 108: The Infrastructure for Research on
- Page 109 and 110: Years’ War (1586-1648) and the im
- Page 111 and 112: The catch of cod and haddock has ne
- Page 113 and 114: were active in the herring fishery.
- Page 115 and 116: In 1719 the States General forbade
- Page 117 and 118: 15 lasts. Its average crew was abou
- Page 119 and 120: H.A.H. Boelmans Kranenburg and J.P.
- Page 121 and 122: The Sea Fisheries of the British Is
- Page 123 and 124: qualitative and uncorroborated, the
- Page 125 and 126: fishing is clearly apparent in refe
- Page 127 and 128: the percentage was possibly higher.
- Page 129 and 130: across large expanses of sea. Moreo
- Page 131 and 132: This sudden contraction was of some
- Page 133 and 134: in English and Welsh ports is avail
- Page 135 and 136: eyond the means of the inland urban
- Page 137 and 138:
A similar pattern of incremental in
- Page 139 and 140:
crofting communities of the highlan
- Page 141 and 142:
oceanographers might well provide h
- Page 143 and 144:
R N W Robinson, ‘The English Fish
- Page 145 and 146:
Norwegian Fisheries 1100-1970 Main
- Page 147 and 148:
ejected. The new social and economi
- Page 149 and 150:
In this early phase of commercial f
- Page 151 and 152:
common contention of historians tha
- Page 153 and 154:
The area which was dominated to the
- Page 155 and 156:
heavier competition on the fish mar
- Page 157 and 158:
and Lofoten reclaimed its pre-emine
- Page 159 and 160:
Russian sailing merchants from the
- Page 161 and 162:
experiment during a deep economic c
- Page 163 and 164:
In the cod fisheries, conflict was
- Page 165 and 166:
of the century, the number fell rap
- Page 167 and 168:
Nordlandene (Oslo, 1993) Klepp, Asb
- Page 169 and 170:
Fisheries in Western Sweden c1650-1
- Page 171 and 172:
From the older, printed and non-pri
- Page 173 and 174:
(National Archives) is the so calle
- Page 175 and 176:
Statistics - some examples Table I.
- Page 177 and 178:
Catches and Manpower in the Danish
- Page 179 and 180:
300,000 barrels from the Sound and
- Page 181 and 182:
The wealth of monasteries around th
- Page 183 and 184:
In order to assess the magnitude of
- Page 185 and 186:
herring trade was to be challenged.
- Page 187 and 188:
fisheries off the Scaw and other sm
- Page 189 and 190:
which had been founded on a forbidd
- Page 191 and 192:
good years around 1617-22. 334 Evid
- Page 193 and 194:
from the fish trade to concentrate
- Page 195 and 196:
Norway and 43% abroad, mainly to L
- Page 197 and 198:
decade of the century did fishermen
- Page 199 and 200:
districts are rounded sums). Howeve
- Page 201 and 202:
decades the anchor seine was allowe
- Page 203 and 204:
By 1995, the fishing industry seems
- Page 205 and 206:
state G.F.C. Oeder will eventually
- Page 207 and 208:
Contributors Bertil Andersson, PhD,
- Page 209 and 210:
Statistical data on Dutch fishery:
- Page 211 and 212:
Economische Zaken en Arbeid, 1933-1