- Page 1 and 2:
Ba-Phalaborwa Municipality Approved
- Page 3 and 4:
TABLE OF CONTENTS Section A 3 Page
- Page 5 and 6:
B8. Community Needs 148 Section C S
- Page 7 and 8:
A1. Ba-Phalaborwa Municipality: An
- Page 9 and 10:
POWERS & FUNCTIONS AUTHORISATION RE
- Page 11 and 12:
A6.1Phases and Activities of the ID
- Page 13 and 14:
The following structures were respo
- Page 15 and 16:
Structures that manage/drive the ID
- Page 17 and 18:
Structures that manage/drive the ID
- Page 19 and 20:
Structures that manage/drive the ID
- Page 21 and 22: Structures that manage/drive the ID
- Page 23 and 24: Structures that manage/drive the ID
- Page 25 and 26: Structures that manage/drive the ID
- Page 27 and 28: Structures that manage/drive the ID
- Page 29 and 30: Structures that manage/drive the ID
- Page 31 and 32: A6.3 IDP, Budget and PMS Calendar B
- Page 33 and 34: Month Activity Time-Frame • 2009/
- Page 35 and 36: Month Activity Time-Frame • Submi
- Page 37 and 38: November 2010 Month Activity Time-F
- Page 39 and 40: January 2011 Month Activity Time-Fr
- Page 41 and 42: Month Activity Time-Frame & Nationa
- Page 43 and 44: Month Activity Time-Frame • Place
- Page 45 and 46: Month Activity Time-Frame and Distr
- Page 47 and 48: The structure of the Municipality i
- Page 49 and 50: marketing strategy that will guide
- Page 51 and 52: B2. THE EXTERNAL ENVIRONMENT The Mu
- Page 53 and 54: PRINCIPLE 3: Government spending on
- Page 55 and 56: Map B4: Ba-Phalaborwa Municipal Bou
- Page 57 and 58: Area Section Number of Stands Vacan
- Page 59 and 60: Maenetja and Balapye-Kgoatla commun
- Page 61 and 62: Game Vest Croc Ranch 3 Game Lodge 1
- Page 63 and 64: Potential infill projects (Namakgal
- Page 65 and 66: Male 61 807 47% Female 69 717 53% T
- Page 67 and 68: Concentration/Growth Point Surround
- Page 69 and 70: Persons % Sepedi 40.3 Sesotho 2.2 S
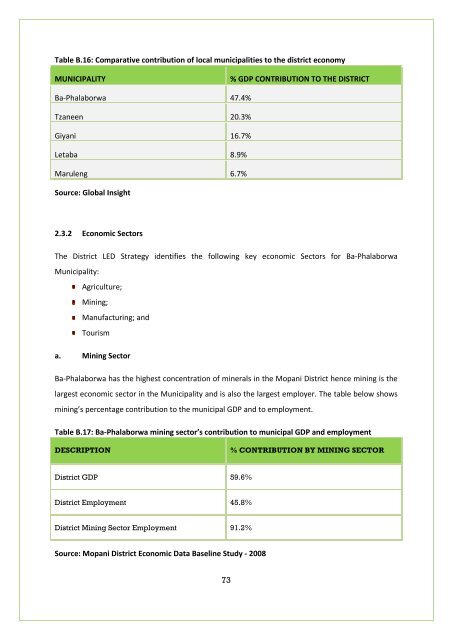
- Page 71: Gravelotte District growth point Lu
- Page 75 and 76: magnetite, nickel sulphate, anode s
- Page 77 and 78: The Mohale quartz deposit appears o
- Page 79 and 80: Game farming Game farming for selli
- Page 81 and 82: present an opportunity for diversif
- Page 83 and 84: Table B.24: Development potentials
- Page 85 and 86: There is a possibility of creating
- Page 87 and 88: Needs identified by informal econom
- Page 89 and 90: The majority of household heads are
- Page 91 and 92: Table B.30: Distribution of food pa
- Page 93 and 94: Water pollution: Mainly the mines,
- Page 95 and 96: B3. Institutional Arrangements The
- Page 97 and 98: Grant Allocation Adjusted Budget Re
- Page 99 and 100: with the households that qualifies
- Page 101 and 102: The following tables show access by
- Page 103 and 104: TYPE OF FACILITY NUMBER OF HOUSEHOL
- Page 105 and 106: The following table presents water
- Page 107 and 108: WARD AFFECTED AREA (Village/Section
- Page 109 and 110: Key Issues with regard to water and
- Page 111 and 112: Paraffin 2 684 (7.9%) 1 741 (5.2%)
- Page 113 and 114: Lulekani A total of 9.75 km of road
- Page 115 and 116: B5.4 Waste Management The Municipal
- Page 117 and 118: Year Allocation Delivery % Delivere
- Page 119 and 120: TYPE OF DWELLING Town/cluster/se mi
- Page 121 and 122: Giyani to Greater Tzaneen Giyani to
- Page 123 and 124:
WARD LOCATION QTY COST ESTIMATE Sub
- Page 125 and 126:
WARD LOCATION QTY COST ESTIMATE 7 N
- Page 127 and 128:
WARD LOCATION QTY COAST ESTIMATE 5
- Page 129 and 130:
WARD LOCATION QTY COAST ESTIMATE Ma
- Page 131 and 132:
Spare Capacity 4 Mton/a 90% of wago
- Page 133 and 134:
Phalaborwa Library needs to be exte
- Page 135 and 136:
There is a need for public particip
- Page 137 and 138:
Gravelotte and Selwane There are no
- Page 139 and 140:
WARD LOCATION NUMBER OF CLINICS 2 S
- Page 141 and 142:
June 7 7 0 14 July 1 5 2 1 August 1
- Page 143 and 144:
Community Radio Station Educational
- Page 145 and 146:
The Drop-In centres are funded by t
- Page 147 and 148:
B5.12 Educational Facilities Table
- Page 149 and 150:
Ward Community Needs/Challenges Loc
- Page 151 and 152:
Ward Community Needs/Challenges Loc
- Page 153 and 154:
Ward Community Needs/Challenges Loc
- Page 155 and 156:
Ward Community Needs/Challenges Loc
- Page 157 and 158:
Ward Community Needs/Challenges Loc
- Page 159 and 160:
Ward Community Needs/Challenges Loc
- Page 161 and 162:
Ward Community Needs/Challenges Loc
- Page 163 and 164:
Ward Community Needs/Challenges Loc
- Page 165 and 166:
Ward No. Ward Priority Location Res
- Page 167 and 168:
Ward No. Ward Priority Location Res
- Page 169 and 170:
Ward No. Ward Priority Location Res
- Page 171 and 172:
Based on the environmental scan, th
- Page 173 and 174:
temporary jobs were created against
- Page 175 and 176:
Type of Service Rating Refuse Remov
- Page 177 and 178:
4. Areas with demonstrated economic
- Page 179 and 180:
3. Move beyond mere focusing on int
- Page 181 and 182:
Strengths The billing system has be
- Page 183 and 184:
in this regard is very important an
- Page 185 and 186:
(e) to encourage the involvement of
- Page 187 and 188:
• Building the Developmental Stat
- Page 189 and 190:
13 The Delivery Agreement for Outco
- Page 191 and 192:
C4.2 Mission “Best tourist destin
- Page 193 and 194:
strategy. In this way the district
- Page 195 and 196:
Developmental and performance orien
- Page 197 and 198:
government. The Limpopo Province ha
- Page 199 and 200:
PERSPECTIVE MTSF COGTA MTAS LEGDP (
- Page 201 and 202:
PERSPECTIVE MTSF COGTA MTAS LEGDP (
- Page 203 and 204:
Strategic Goal Financial Viability
- Page 205 and 206:
Strategic Goal Economic and Tourism
- Page 207 and 208:
Strategic Goal Developmental and Pe
- Page 209 and 210:
Strategic Goal Enhanced stakeholder
- Page 211 and 212:
Objective Outcome Strategic Key Per
- Page 213 and 214:
Objective Outcome Strategic Key Per
- Page 215 and 216:
Objective Outcome Strategic Key Per
- Page 217 and 218:
C5. Ba-Phalaborwa Turnaround Strate
- Page 219 and 220:
No. Priority Turn Around Focal Area
- Page 221 and 222:
No. Priority Turn Around Focal Area
- Page 223 and 224:
No. Priority Turn Around Focal Area
- Page 225 and 226:
No. Priority Turn Around Focal Area
- Page 227 and 228:
No. Priority Turn Around Focal Area
- Page 229 and 230:
No. Priority Turn Around Focal Area
- Page 231 and 232:
No. Priority Turn Around Focal Area
- Page 233 and 234:
C7.CONCLUSION: The afore-mentioned
- Page 235 and 236:
D2. Operational and Maintenance Pro
- Page 237 and 238:
Implementing Dept Operational & Mai
- Page 239 and 240:
Implementing Dept Mun/09 Furniture
- Page 241 and 242:
Implementing Dept Operational & Mai
- Page 243 and 244:
Implementing Dept Operational & Mai
- Page 245 and 246:
Implementing Dept Operational & Mai
- Page 247 and 248:
Implementing Dept Operational & Mai
- Page 249 and 250:
Implementing Dept Operational & Mai
- Page 251 and 252:
D3. Programmes, Strategies and Plan
- Page 253 and 254:
Implementing Dept. Programmes, Stra
- Page 255 and 256:
Implementing Dept. Programmes, Stra
- Page 257 and 258:
Implementing Dept. Programmes, Stra
- Page 259 and 260:
Implementing Dept. Programmes, Stra
- Page 261 and 262:
Implementing Dept. Programmes, Stra
- Page 263 and 264:
Implementing Dept Tech/23 Maintenan
- Page 265 and 266:
Implementing Dept Capital Projects
- Page 267 and 268:
Implementing Dept Capital Projects
- Page 269 and 270:
Implementing Dept Services Capital
- Page 271 and 272:
Implementing Dept MIG Projects Sour
- Page 273 and 274:
Implementing Dept MIG Projects Sour
- Page 275 and 276:
Implementing Dept NDPG Projects Sou
- Page 277 and 278:
Project Name Project Location Descr
- Page 279 and 280:
Project Name Project Location Proje
- Page 281 and 282:
Project Name Project Location Proje
- Page 283 and 284:
Project Name Project Location Proje
- Page 285 and 286:
Project Name Project Location Proje
- Page 287 and 288:
D9. Libsa Projects Strategic Object
- Page 289 and 290:
Name of Project Purpose of the Proj
- Page 291 and 292:
D11. Rio Tinto Palabora Foundation
- Page 293 and 294:
D13. South African Airlink Project
- Page 295 and 296:
E1. Ba-Phalaborwa Municipality IDP
- Page 297 and 298:
male 5 Maseke 197 197 197 0 6 Matik
- Page 299 and 300:
E2. Land Use Management Scheme of B
- Page 301 and 302:
Erection and Use of Buildings or Us
- Page 303 and 304:
The Local Government Anti-Corruptio
- Page 305 and 306:
Embezzlement This involves theft of
- Page 307 and 308:
• ASGISA (Accelerated and Shared
- Page 309 and 310:
Legislation Key legislation that gu
- Page 311 and 312:
• Gathering of information to fil
- Page 313 and 314:
E7. Recruitment and Retention Strat
- Page 315 and 316:
• Ensures that there is focus in
- Page 317 and 318:
The realization of our IDP depends
- Page 319 and 320:
(i) The allocation and co-ordinatio
- Page 321:
321