

The Global Innovation Index 2012
The Global Innovation Index 2012
The Global Innovation Index 2012

You also want an ePaper? Increase the reach of your titles
YUMPU automatically turns print PDFs into web optimized ePapers that Google loves.
22<br />
THE GLOBAL INNOVATION INDEX <strong>2012</strong> 1: <strong>The</strong> <strong>Global</strong> <strong>Innovation</strong> <strong>Index</strong> <strong>2012</strong><br />
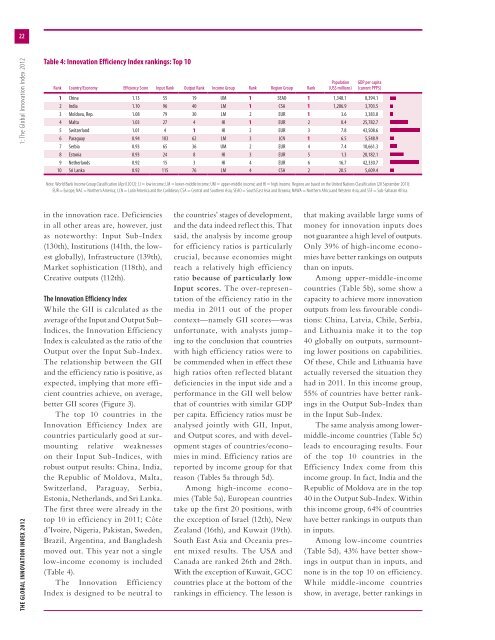
Table 4: <strong>Innovation</strong> Efficiency <strong>Index</strong> rankings: Top 10<br />
rank country/Economy Efficiency Score Input rank Output rank Income Group rank region Group rank<br />
in the innovation race. Deficiencies<br />
in all other areas are, however, just<br />
as noteworthy: Input Sub-<strong>Index</strong><br />
(130th), Institutions (141th, the lowest<br />
globally), Infrastructure (139th),<br />
Market sophistication (118th), and<br />
Creative outputs (112th).<br />
<strong>The</strong> <strong>Innovation</strong> Efficiency <strong>Index</strong><br />
While the GII is calculated as the<br />
average of the Input and Output Sub-<br />
Indices, the <strong>Innovation</strong> Efficiency<br />
<strong>Index</strong> is calculated as the ratio of the<br />
Output over the Input Sub-<strong>Index</strong>.<br />
<strong>The</strong> relationship between the GII<br />
and the efficiency ratio is positive, as<br />
expected, implying that more efficient<br />
countries achieve, on average,<br />
better GII scores (Figure 3).<br />
<strong>The</strong> top 10 countries in the<br />
<strong>Innovation</strong> Efficiency <strong>Index</strong> are<br />
countries particularly good at surmounting<br />
relative weaknesses<br />
on their Input Sub-Indices, with<br />
robust output results: China, India,<br />
the Republic of Moldova, Malta,<br />
Switzerland, Paraguay, Serbia,<br />
Estonia, Netherlands, and Sri Lanka.<br />
<strong>The</strong> first three were already in the<br />
top 10 in efficiency in 2011; Côte<br />
d’Ivoire, Nigeria, Pakistan, Sweden,<br />
Brazil, Argentina, and Bangladesh<br />
moved out. This year not a single<br />
low-income economy is included<br />
(Table 4).<br />
<strong>The</strong> <strong>Innovation</strong> Efficiency<br />
<strong>Index</strong> is designed to be neutral to<br />
the countries’ stages of development,<br />
and the data indeed reflect this. That<br />
said, the analysis by income group<br />
for efficiency ratios is particularly<br />
crucial, because economies might<br />
reach a relatively high efficiency<br />
ratio because of particularly low<br />
Input scores. <strong>The</strong> over-representation<br />
of the efficiency ratio in the<br />
media in 2011 out of the proper<br />
context—namely GII scores—was<br />
unfortunate, with analysts jumping<br />
to the conclusion that countries<br />
with high efficiency ratios were to<br />
be commended when in effect these<br />
high ratios often reflected blatant<br />
deficiencies in the input side and a<br />
performance in the GII well below<br />
that of countries with similar GDP<br />
per capita. Efficiency ratios must be<br />
analysed jointly with GII, Input,<br />
and Output scores, and with development<br />
stages of countries/economies<br />
in mind. Efficiency ratios are<br />
reported by income group for that<br />
reason (Tables 5a through 5d).<br />
Among high-income economies<br />
(Table 5a), European countries<br />
take up the first 20 positions, with<br />
the exception of Israel (12th), New<br />
Zealand (16th), and Kuwait (19th).<br />
South East Asia and Oceania present<br />
mixed results. <strong>The</strong> USA and<br />
Canada are ranked 26th and 28th.<br />
With the exception of Kuwait, GCC<br />
countries place at the bottom of the<br />
rankings in efficiency. <strong>The</strong> lesson is<br />
population<br />
(uS$ millions)<br />
GDp per capita<br />
(current ppp$)<br />
1 china 1.13 55 19 uM 1 SEAO 1 1,348.1 8,394.1<br />
2 India 1.10 96 40 LM 1 cSA 1 1,206.9 3,703.5<br />
3 Moldova, rep. 1.08 79 30 LM 2 Eur 1 3.6 3,383.0<br />
4 Malta 1.03 27 4 HI 1 Eur 2 0.4 25,782.7<br />
5 Switzerland 1.01 4 1 HI 2 Eur 3 7.8 43,508.6<br />
6 paraguay 0.94 103 62 LM 3 LcN 1 6.5 5,548.9<br />
7 Serbia 0.93 65 36 uM 2 Eur 4 7.4 10,661.3<br />
8 Estonia 0.93 24 8 HI 3 Eur 5 1.3 20,182.1<br />
9 Netherlands 0.92 15 3 HI 4 Eur 6 16.7 42,330.7<br />
10 Sri Lanka 0.92 115 76 LM 4 cSA 2 20.5 5,609.4<br />
Note: World Bank Income Group Classification (April <strong>2012</strong>): LI = low income; LM = lower-middle income; UM = upper-middle income; and HI = high income. Regions are based on the United Nations Classification (20 September 2011):<br />
EUR = Europe; NAC = Northern America; LCN = Latin America and the Caribbean; CSA = Central and Southern Asia; SEAO = South East Asia and Oceania; NAWA = Northern Africa and Western Asia; and SSF = Sub-Saharan Africa.<br />
that making available large sums of<br />
money for innovation inputs does<br />
not guarantee a high level of outputs.<br />
Only 39% of high-income economies<br />
have better rankings on outputs<br />
than on inputs.<br />
Among upper-middle-income<br />
countries (Table 5b), some show a<br />
capacity to achieve more innovation<br />
outputs from less favourable conditions:<br />
China, Latvia, Chile, Serbia,<br />
and Lithuania make it to the top<br />
40 globally on outputs, surmounting<br />
lower positions on capabilities.<br />
Of these, Chile and Lithuania have<br />
actually reversed the situation they<br />
had in 2011. In this income group,<br />
55% of countries have better rankings<br />
in the Output Sub-<strong>Index</strong> than<br />
in the Input Sub-<strong>Index</strong>.<br />
<strong>The</strong> same analysis among lowermiddle-income<br />
countries (Table 5c)<br />
leads to encouraging results. Four<br />
of the top 10 countries in the<br />
Efficiency <strong>Index</strong> come from this<br />
income group. In fact, India and the<br />
Republic of Moldova are in the top<br />
40 in the Output Sub-<strong>Index</strong>. Within<br />
this income group, 64% of countries<br />
have better rankings in outputs than<br />
in inputs.<br />
Among low-income countries<br />
(Table 5d), 43% have better showings<br />
in output than in inputs, and<br />
none is in the top 10 on efficiency.<br />
While middle-income countries<br />
show, in average, better rankings in


