

The Global Innovation Index 2012
The Global Innovation Index 2012
The Global Innovation Index 2012

You also want an ePaper? Increase the reach of your titles
YUMPU automatically turns print PDFs into web optimized ePapers that Google loves.
26<br />
THE GLOBAL INNOVATION INDEX <strong>2012</strong> 1: <strong>The</strong> <strong>Global</strong> <strong>Innovation</strong> <strong>Index</strong> <strong>2012</strong><br />
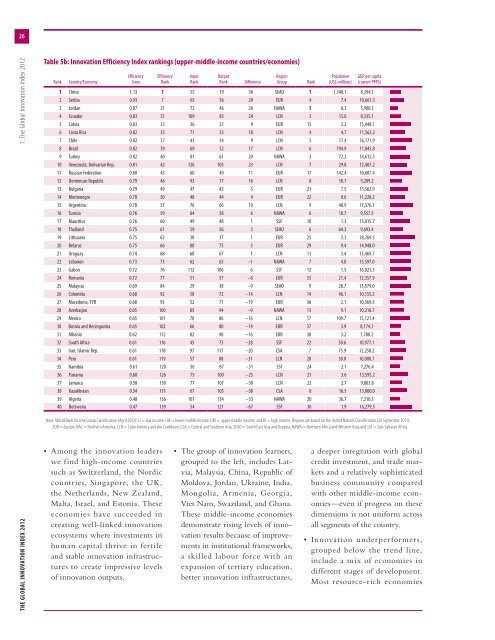
Table 5b: <strong>Innovation</strong> Efficiency <strong>Index</strong> rankings (upper-middle-income countries/economies)<br />
rank country/Economy<br />
Efficiency<br />
Score<br />
• Among the innovation leaders<br />
we find high-income countries<br />
such as Switzerland, the Nordic<br />
countries, Singapore, the UK,<br />
the Netherlands, New Zealand,<br />
Malta, Israel, and Estonia. <strong>The</strong>se<br />
economies have succeeded in<br />
creating well-linked innovation<br />
ecosystems where investments in<br />
human capital thrive in fertile<br />
and stable innovation infrastructures<br />
to create impressive levels<br />
of innovation outputs.<br />
Efficiency<br />
rank<br />
Input<br />
rank<br />
Output<br />
rank Difference<br />
• <strong>The</strong> group of innovation learners,<br />
grouped to the left, includes Latvia,<br />
Malaysia, China, Republic of<br />
Moldova, Jordan, Ukraine, India,<br />
Mongolia, Armenia, Georgia,<br />
Viet Nam, Swaziland, and Ghana.<br />
<strong>The</strong>se middle-income economies<br />
demonstrate rising levels of innovation<br />
results because of improvements<br />
in institutional frameworks,<br />
a skilled labour force with an<br />
expansion of tertiary education,<br />
better innovation infrastructures,<br />
region<br />
Group rank<br />
population<br />
(uS$ millions)<br />
GDp per capita<br />
(current ppp$)<br />
1 china 1.13 1 55 19 36 SEAO 1 1,348.1 8,394.1<br />
2 Serbia 0.93 7 65 36 29 Eur 4 7.4 10,661.3<br />
3 Jordan 0.87 21 72 46 26 NAWA 1 6.3 5,900.3<br />
4 Ecuador 0.83 31 109 85 24 LcN 3 15.0 8,335.1<br />
5 Latvia 0.83 33 36 27 9 Eur 15 2.2 15,448.1<br />
6 costa rica 0.82 35 71 53 18 LcN 4 4.7 11,562.2<br />
7 chile 0.82 37 43 34 9 LcN 5 17.4 16,171.9<br />
8 Brazil 0.82 39 69 52 17 LcN 6 194.9 11,845.8<br />
9 Turkey 0.82 40 81 61 20 NAWA 3 72.2 14,615.5<br />
10 venezuela, Bolivarian rep. 0.81 42 126 103 23 LcN 7 29.8 12,407.2<br />
11 russian federation 0.80 43 60 49 11 Eur 17 142.4 16,687.4<br />
12 Dominican republic 0.79 46 93 77 16 LcN 8 10.1 9,289.2<br />
13 Bulgaria 0.79 49 47 42 5 Eur 21 7.5 13,562.9<br />
14 Montenegro 0.78 50 48 44 4 Eur 22 0.6 11,228.2<br />
15 Argentina 0.78 51 76 66 10 LcN 9 40.9 17,376.1<br />
16 Tunisia 0.76 59 64 58 6 NAWA 6 10.7 9,557.5<br />
17 Mauritius 0.76 60 49 48 1 SSf 10 1.3 15,015.7<br />
18 Thailand 0.75 61 59 56 3 SEAO 6 64.3 9,693.4<br />
19 Lithuania 0.75 62 38 37 1 Eur 25 3.3 18,769.5<br />
20 Belarus 0.75 66 80 75 5 Eur 29 9.4 14,948.0<br />
21 uruguay 0.74 68 68 67 1 LcN 11 3.4 15,469.7<br />
22 Lebanon 0.73 73 62 63 –1 NAWA 7 4.0 15,597.0<br />
23 Gabon 0.72 76 112 106 6 SSf 12 1.5 16,021.5<br />
24 romania 0.72 77 51 57 –6 Eur 33 21.4 12,357.9<br />
25 Malaysia 0.69 84 29 38 –9 SEAO 9 28.7 15,579.0<br />
26 colombia 0.68 92 58 72 –14 LcN 14 46.1 10,155.3<br />
27 Macedonia, fyr 0.68 93 52 71 –19 Eur 36 2.1 10,369.5<br />
28 Azerbaijan 0.65 100 85 94 –9 NAWA 13 9.1 10,216.7<br />
29 Mexico 0.65 101 70 86 –16 LcN 17 109.7 15,121.4<br />
30 Bosnia and Herzegovina 0.65 102 66 80 –14 Eur 37 3.9 8,174.1<br />
31 Albania 0.62 112 82 98 –16 Eur 38 3.2 7,780.2<br />
32 South Africa 0.61 116 45 73 –28 SSf 22 50.6 10,977.1<br />
33 Iran, Islamic rep. 0.61 118 97 117 –20 cSA 7 75.9 12,258.2<br />
34 peru 0.61 119 57 88 –31 LcN 20 30.0 10,000.7<br />
35 Namibia 0.61 120 56 87 –31 SSf 24 2.1 7,276.4<br />
36 panama 0.60 126 75 100 –25 LcN 21 3.6 13,595.2<br />
37 Jamaica 0.58 130 77 107 –30 LcN 22 2.7 9,003.8<br />
38 Kazakhstan 0.54 131 67 105 –38 cSA 8 16.5 13,060.0<br />
39 Algeria 0.48 136 101 134 –33 NAWA 20 36.7 7,210.3<br />
40 Botswana 0.47 139 54 121 –67 SSf 30 1.9 16,279.5<br />
Note: World Bank Income Group Classification (April <strong>2012</strong>): LI = low income; LM = lower-middle income; UM = upper-middle income; and HI = high income. Regions are based on the United Nations Classification (20 September 2011):<br />
EUR = Europe; NAC = Northern America; LCN = Latin America and the Caribbean; CSA = Central and Southern Asia; SEAO = South East Asia and Oceania; NAWA = Northern Africa and Western Asia; and SSF = Sub-Saharan Africa.<br />
a deeper integration with global<br />
credit investment, and trade markets<br />
and a relatively sophisticated<br />
business community compared<br />
with other middle-income economies—even<br />
if progress on these<br />
dimensions is not uniform across<br />
all segments of the country.<br />
• <strong>Innovation</strong> underperformers,<br />
grouped below the trend line,<br />
include a mix of economies in<br />
different stages of development.<br />
Most resource-rich economies


