- Page 1 and 2:
The Proceedings of the 6th Internat
- Page 3 and 4:
Contents Paper Title Author(s) Page
- Page 5 and 6:
Preface These Proceedings are the w
- Page 7 and 8:
Biographies of contributing authors
- Page 9 and 10:
Department of Computer Science, IQR
- Page 11 and 12:
Using the Longest Common Substring
- Page 13 and 14:
Jaime Acosta Some techniques that u
- Page 15 and 16:
Jaime Acosta assigned by an anti-vi
- Page 17 and 18:
Jaime Acosta Cormen, T.H., Leiserso
- Page 19 and 20: Hind Al Falasi and Liren Zhang tran
- Page 21 and 22: Hind Al Falasi and Liren Zhang ther
- Page 23 and 24: Hind Al Falasi and Liren Zhang the
- Page 25 and 26: Edwin Leigh Armistead and Thomas Mu
- Page 27 and 28: Deception Operations Security (OPS
- Page 29 and 30: Edwin Leigh Armistead and Thomas Mu
- Page 31 and 32: Edwin Leigh Armistead and Thomas Mu
- Page 33 and 34: The Uses and Limits of Game Theory
- Page 35 and 36: 3. Limits to using game theory 3.1
- Page 37 and 38: Merritt Baer Effective cyberintrusi
- Page 39 and 40: Merritt Baer 1.5), there seems to b
- Page 41 and 42: Merritt Baer Report of the Defense
- Page 43 and 44: Ivan Burke and Renier van Heerden F
- Page 45 and 46: Ivan Burke and Renier van Heerden a
- Page 47 and 48: Ivan Burke and Renier van Heerden F
- Page 49 and 50: Ivan Burke and Renier van Heerden F
- Page 51 and 52: Ivan Burke and Renier van Heerden F
- Page 53 and 54: Marco Carvalho et al. systems start
- Page 55 and 56: Marco Carvalho et al. Benatallah, 2
- Page 57 and 58: Marco Carvalho et al. management la
- Page 59 and 60: Marco Carvalho et al. Figure 4: Sta
- Page 61 and 62: Marco Carvalho et al. Sorrels, D.,
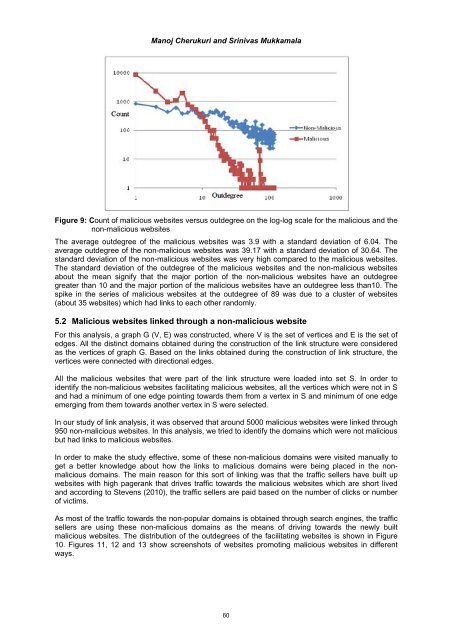
- Page 63 and 64: Manoj Cherukuri and Srinivas Mukkam
- Page 65 and 66: Manoj Cherukuri and Srinivas Mukkam
- Page 67 and 68: Manoj Cherukuri and Srinivas Mukkam
- Page 69: Manoj Cherukuri and Srinivas Mukkam
- Page 73 and 74: Manoj Cherukuri and Srinivas Mukkam
- Page 75 and 76: Manoj Cherukuri and Srinivas Mukkam
- Page 77 and 78: Manoj Cherukuri and Srinivas Mukkam
- Page 79 and 80: Mecealus Cronkrite et al. to see bo
- Page 81 and 82: Mecealus Cronkrite et al. trivial.
- Page 83 and 84: Mecealus Cronkrite et al. socially
- Page 85 and 86: Mecealus Cronkrite et al. The views
- Page 87 and 88: Vincent Garramone and Daniel Likari
- Page 89 and 90: Vincent Garramone and Daniel Likari
- Page 91 and 92: Vincent Garramone and Daniel Likari
- Page 93 and 94: Vincent Garramone and Daniel Likari
- Page 95 and 96: Stephen Groat et al. Sections 4 and
- Page 97 and 98: Stephen Groat et al. probability fo
- Page 99 and 100: Stephen Groat et al. host. In this
- Page 101 and 102: Stephen Groat et al. changing addre
- Page 103 and 104: Marthie Grobler et al. leadership,
- Page 105 and 106: Marthie Grobler et al. apply to sta
- Page 107 and 108: Marthie Grobler et al. 6. Working t
- Page 109 and 110: Cyber Strategy and the Law of Armed
- Page 111 and 112: Ulf Haeussler Alliance and Allies r
- Page 113 and 114: Ulf Haeussler following the invocat
- Page 115 and 116: Ulf Haeussler NCSA (2009) NCSA Supp
- Page 117 and 118: Karim Hamza and Van Dalen of respon
- Page 119 and 120: Karim Hamza and Van Dalen From a mi
- Page 121 and 122:
Karim Hamza and Van Dalen productiv
- Page 123 and 124:
Intelligence-Driven Computer Networ
- Page 125 and 126:
Eric Hutchins et al. of defensive a
- Page 127 and 128:
Eric Hutchins et al. Defenders can
- Page 129 and 130:
Eric Hutchins et al. Equally as imp
- Page 131 and 132:
Eric Hutchins et al. X-Mailer: Yaho
- Page 133 and 134:
Eric Hutchins et al. Received: (qma
- Page 135 and 136:
Eric Hutchins et al. U.S.-China Eco
- Page 137 and 138:
Saara Jantunen and Aki-Mauri Huhtin
- Page 139 and 140:
Saara Jantunen and Aki-Mauri Huhtin
- Page 141 and 142:
Saara Jantunen and Aki-Mauri Huhtin
- Page 143 and 144:
Saara Jantunen and Aki-Mauri Huhtin
- Page 145 and 146:
Brian Jewell and Justin Beaver In t
- Page 147 and 148:
Brian Jewell and Justin Beaver Figu
- Page 149 and 150:
4. Evaluation Brian Jewell and Just
- Page 151 and 152:
Brian Jewell and Justin Beaver othe
- Page 153 and 154:
Detection of YASS Using Calibration
- Page 155 and 156:
Kesav Kancherla and Srinivas Mukkam
- Page 157 and 158:
M M M Su−2 Sv ∑∑ u= 1 v= 1 h(
- Page 159 and 160:
5.2 ROC curves Kesav Kancherla and
- Page 161 and 162:
Developing a Knowledge System for I
- Page 163 and 164:
Louise Leenen et al. We distinction
- Page 165 and 166:
Louise Leenen et al. There is growi
- Page 167 and 168:
3.1 Needs analysis Louise Leenen et
- Page 169 and 170:
Louise Leenen et al. Kroenke, D.M.
- Page 171 and 172:
Jose Mas y Rubi et al. As we can se
- Page 173 and 174:
Figure 2: CALEA forensic model (Pel
- Page 175 and 176:
Jose Mas y Rubi et al. Table 2: Com
- Page 177 and 178:
Jose Mas y Rubi et al. Another pend
- Page 179 and 180:
Tree of Objectives Acknowledgements
- Page 181 and 182:
Secure Proactive Recovery - a Hardw
- Page 183 and 184:
Ruchika Mehresh et al. implementing
- Page 185 and 186:
Ruchika Mehresh et al. The coordina
- Page 187 and 188:
Ruchika Mehresh et al. multiplicati
- Page 189 and 190:
Ruchika Mehresh et al. Table 2: App
- Page 191 and 192:
2. Network infiltration detection D
- Page 193 and 194:
David Merritt and Barry Mullins on
- Page 195 and 196:
David Merritt and Barry Mullins Ess
- Page 197 and 198:
David Merritt and Barry Mullins Dev
- Page 199 and 200:
Muhammad Naveed Pakistan Computer E
- Page 201 and 202:
Muhammad Naveed response could also
- Page 203 and 204:
Muhammad Naveed Table 10: Aggressiv
- Page 205 and 206:
Muhammad Naveed 2006 Tcp Open Mysql
- Page 207 and 208:
Muhammad Naveed 8009 Tcp Open Ajp13
- Page 209 and 210:
Muhammad Naveed Austalian Taxation
- Page 211 and 212:
Alexandru Nitu world and bring it i
- Page 213 and 214:
Alexandru Nitu Article 51 restricts
- Page 215 and 216:
Alexandru Nitu As IW strategy and t
- Page 217 and 218:
Cyberwarfare and Anonymity Christop
- Page 219 and 220:
Christopher Perr attacks again help
- Page 221 and 222:
Christopher Perr about the current
- Page 223 and 224:
Catch me if you can: Cyber Anonymit
- Page 225 and 226:
David Rohret and Michael Kraft reve
- Page 227 and 228:
David Rohret and Michael Kraft sary
- Page 229 and 230:
Data (Evidence) Removal Shield Davi
- Page 231 and 232:
Neutrality in the Context of Cyberw
- Page 233 and 234:
Julie Ryan and Daniel Ryan 18th cen
- Page 235 and 236:
Julie Ryan and Daniel Ryan “Decla
- Page 237 and 238:
Julie Ryan and Daniel Ryan von Glah
- Page 239 and 240:
Harm Schotanus et al. In the remain
- Page 241 and 242:
Harm Schotanus et al. 2.3.1 Secure
- Page 243 and 244:
Harm Schotanus et al. In this setup
- Page 245 and 246:
Harm Schotanus et al. the label (by
- Page 247 and 248:
Harm Schotanus et al. these aspects
- Page 249 and 250:
Maria Semmelrock-Picej et al. they
- Page 251 and 252:
Maria Semmelrock-Picej et al. User
- Page 253 and 254:
Maria Semmelrock-Picej et al. SPIKE
- Page 255 and 256:
Maria Semmelrock-Picej et al. A cl
- Page 257 and 258:
Maria Semmelrock-Picej et al. in co
- Page 259 and 260:
Maria Semmelrock-Picej et al. In th
- Page 261 and 262:
Maria Semmelrock-Picej et al. Fuchs
- Page 263 and 264:
Madhu Shankarapani and Srinivas Muk
- Page 265 and 266:
Figure 1: UPX packed Trojan Figure
- Page 267 and 268:
Trojan.Zb ot- 1342.mal Trojan.Sp y.
- Page 269 and 270:
Madhu Shankarapani and Srinivas Muk
- Page 271 and 272:
Namosha Veerasamy and Marthie Grobl
- Page 273 and 274:
Namosha Veerasamy and Marthie Grobl
- Page 275 and 276:
Namosha Veerasamy and Marthie Grobl
- Page 277 and 278:
4. Conclusion Namosha Veerasamy and
- Page 279 and 280:
Tanya Zlateva et al. Computer Infor
- Page 281 and 282:
Tanya Zlateva et al. security and v
- Page 283 and 284:
Tanya Zlateva et al. court opinions
- Page 285 and 286:
Tanya Zlateva et al. 5. Pedagogy, e
- Page 287 and 288:
PhD Research Papers 277
- Page 289 and 290:
Shada Alsalamah et al. Level 3 all
- Page 291 and 292:
Shada Alsalamah et al. assure the a
- Page 293 and 294:
Shada Alsalamah et al. for Health I
- Page 295 and 296:
3. Hematology Laboratory System Who
- Page 297 and 298:
Shada Alsalamah et al. Pirnejad, H.
- Page 299 and 300:
Michael Bilzor a diverse base of U.
- Page 301 and 302:
Michael Bilzor In our current exper
- Page 303 and 304:
5. Execution monitor theory Michael
- Page 305 and 306:
Michael Bilzor design was run in si
- Page 307 and 308:
Michael Bilzor over testbench metho
- Page 309 and 310:
Evan Dembskey and Elmarie Biermann
- Page 311 and 312:
Evan Dembskey and Elmarie Biermann
- Page 313 and 314:
Evan Dembskey and Elmarie Biermann
- Page 315 and 316:
Evan Dembskey and Elmarie Biermann
- Page 317 and 318:
Theoretical Offensive Cyber Militia
- Page 319 and 320:
Rain Ottis Last, but not least, it
- Page 321 and 322:
Rain Ottis an infantry battalion, w
- Page 323 and 324:
Rain Ottis Ottis, R. (2008) “Anal
- Page 325 and 326:
Work in Progress Papers 315
- Page 327 and 328:
Large-Scale Analysis of Continuous
- Page 329 and 330:
References William Acosta Abadi, D.
- Page 331 and 332:
Natarajan Vijayarangan top box unit
- Page 333 and 334:
Natarajan Vijayarangan The proposed