

Class-8 Heavy Truck Duty Cycle Project Final Report - Center for ...
Class-8 Heavy Truck Duty Cycle Project Final Report - Center for ...
Class-8 Heavy Truck Duty Cycle Project Final Report - Center for ...

You also want an ePaper? Increase the reach of your titles
YUMPU automatically turns print PDFs into web optimized ePapers that Google loves.
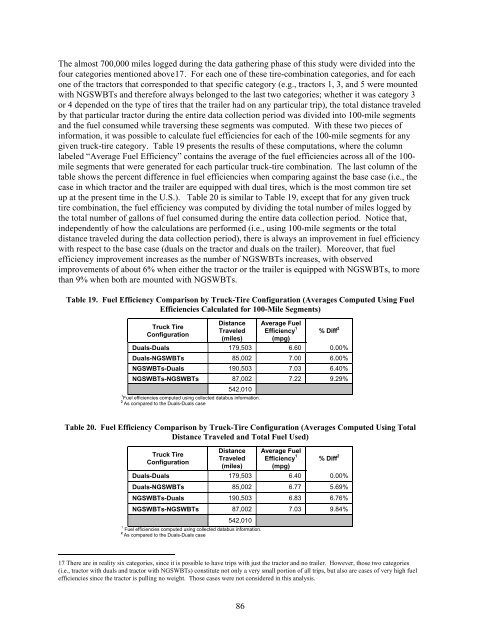
The almost 700,000 miles logged during the data gathering phase of this study were divided into the<br />
four categories mentioned above17. For each one of these tire-combination categories, and <strong>for</strong> each<br />
one of the tractors that corresponded to that specific category (e.g., tractors 1, 3, and 5 were mounted<br />
with NGSWBTs and there<strong>for</strong>e always belonged to the last two categories; whether it was category 3<br />
or 4 depended on the type of tires that the trailer had on any particular trip), the total distance traveled<br />
by that particular tractor during the entire data collection period was divided into 100-mile segments<br />
and the fuel consumed while traversing these segments was computed. With these two pieces of<br />
in<strong>for</strong>mation, it was possible to calculate fuel efficiencies <strong>for</strong> each of the 100-mile segments <strong>for</strong> any<br />
given truck-tire category. Table 19 presents the results of these computations, where the column<br />
labeled “Average Fuel Efficiency” contains the average of the fuel efficiencies across all of the 100mile<br />
segments that were generated <strong>for</strong> each particular truck-tire combination. The last column of the<br />
table shows the percent difference in fuel efficiencies when comparing against the base case (i.e., the<br />
case in which tractor and the trailer are equipped with dual tires, which is the most common tire set<br />
up at the present time in the U.S.). Table 20 is similar to Table 19, except that <strong>for</strong> any given truck<br />
tire combination, the fuel efficiency was computed by dividing the total number of miles logged by<br />
the total number of gallons of fuel consumed during the entire data collection period. Notice that,<br />
independently of how the calculations are per<strong>for</strong>med (i.e., using 100-mile segments or the total<br />
distance traveled during the data collection period), there is always an improvement in fuel efficiency<br />
with respect to the base case (duals on the tractor and duals on the trailer). Moreover, that fuel<br />
efficiency improvement increases as the number of NGSWBTs increases, with observed<br />
improvements of about 6% when either the tractor or the trailer is equipped with NGSWBTs, to more<br />
than 9% when both are mounted with NGSWBTs.<br />
Table 19. Fuel Efficiency Comparison by <strong>Truck</strong>-Tire Configuration (Averages Computed Using Fuel<br />
Efficiencies Calculated <strong>for</strong> 100-Mile Segments)<br />
<strong>Truck</strong> Tire<br />
Configuration<br />
Distance<br />
Traveled<br />
(miles)<br />
Average Fuel<br />
Efficiency 1<br />
(mpg)<br />
% Diff 2<br />
Duals-Duals 179,503 6.60 0.00%<br />
Duals-NGSWBTs 85,002 7.00 6.00%<br />
NGSWBTs-Duals 190,503 7.03 6.40%<br />
NGSWBTs-NGSWBTs 87,002<br />
542,010<br />
7.22 9.29%<br />
1 Fuel efficiencies computed using collected databus in<strong>for</strong>mation.<br />
2 As compared to the Duals-Duals case<br />
Table 20. Fuel Efficiency Comparison by <strong>Truck</strong>-Tire Configuration (Averages Computed Using Total<br />
Distance Traveled and Total Fuel Used)<br />
<strong>Truck</strong> Tire<br />
Configuration<br />
Distance<br />
Traveled<br />
(miles)<br />
Average Fuel<br />
Efficiency 1<br />
(mpg)<br />
% Diff 2<br />
Duals-Duals 179,503 6.40 0.00%<br />
Duals-NGSWBTs 85,002 6.77 5.69%<br />
NGSWBTs-Duals 190,503 6.83 6.76%<br />
NGSWBTs-NGSWBTs 87,002<br />
542,010<br />
7.03 9.84%<br />
1 Fuel efficiencies computed using collected databus in<strong>for</strong>mation.<br />
2 As compared to the Duals-Duals case<br />
17 There are in reality six categories, since it is possible to have trips with just the tractor and no trailer. However, those two categories<br />
(i.e., tractor with duals and tractor with NGSWBTs) constitute not only a very small portion of all trips, but also are cases of very high fuel<br />
efficiencies since the tractor is pulling no weight. Those cases were not considered in this analysis.<br />
86


